


 本文探讨了如何使用统计方法进行异常检测,主要聚焦于数据科学领域,介绍了一系列适用于大数据和人工智能背景的统计技术。这些技术对于识别不寻常模式、确保数据质量和提升算法性能至关重要。
统计方法进行异常检测
Anomaly and fraud detection is a multi-billion-dollar industry. According to a Nilson Report, the amount of global credit card fraud alone was USD 7.6 billion in 2010. In the UK fraudulent credit card transaction losses were estimated at more than USD 1 billion in 2018. To counter these kinds of financial losses a huge amount of resources are employed to identify frauds and anomalies in every single industry.
异常和欺诈检测是一个价值数十亿美元的行业。 根据尼尔森报告( Nilson Report) ,2010年,仅全球信用卡欺诈的金额就达到76亿美元。在英国,2018年欺诈性信用卡交易损失估计超过10亿美元。 为了应对此类财务损失,在每个行业中都使用大量资源来识别欺诈和异常情况。
In data science, “Outlier”, “Anomaly” and “Fraud” are often synonymously used, but there are subtle differences. An “outliers’ generally refers to a data point that somehow stands out from the rest of the crowd. However, when this outlier is completely unexpected and unexplained, it becomes an anomaly. That is to say, all anomalies are outliers but not necessarily all outliers are anomalies. In this article, however, I am using these terms interchangeably.
在数据科学中,“异常值”,“异常”和“欺诈”经常被同义词使用,但存在细微的差异。 “异常值”通常是指以某种方式在其他人群中脱颖而出的数据点。 但是,当此异常值完全出乎意料且无法解释时,它将成为异常。 也就是说,所有异常均是异常值,但不一定所有异常均是异常值。 但是,在本文中,我可以互换使用这些术语。
There are numerous reasons why understanding and detecting outliers are important. As a data scientist when we make data preparation we take great care in understanding if there is any data point unexplained, which may have entered erroneously. Sometimes we filter completely legitimate outlier data points and remove them to ensure greater model performance.
理解和检测异常值很重要的原因有很多。 作为数据科学家,在进行数据准备时,我们会非常小心地理解是否存在无法解释的任何数据点,这些数据点可能会错误输入。 有时,我们会过滤掉完全合法的异常数据点并删除它们,以确保更高的模型性能。
There is also a huge industrial application of anomaly detection. Credit card fraud detection is the most cited one but in numerous other cases anomaly detection is an essential part of doing business such as detecting network intrusion, identifying instrument failure, detecting tumor cells etc.
异常检测也有巨大的工业应用。 信用卡欺诈检测是被引用最多的方法,但在许多其他情况下,异常检测是开展业务的重要组成部分,例如检测网络入侵,识别仪器故障,检测肿瘤细胞等。
A range of tools and techniques are used to detect outliers and anomalies, from simple statistical techniques to complex machine learning algorithms, depending on the complexity of data and sophistication needed. The purpose of this article is to summarise some simple yet powerful statistical techniques that can be readily used for initial screening of outliers. While complex algorithms can be inevitable to use, sometimes simple techniques are more than enough to serve the purpose.
从简单的统计技术到复杂的机器学习算法,根据所需的数据复杂性和复杂性,使用了一系列工具和技术来检测异常值和异常。 本文的目的是总结一些简单但功能强大的统计技术,这些技术可以方便地用于离群值的初始筛选。 尽管可能不可避免地要使用复杂的算法,但有时简单的技术已足以满足要求。
Below is a primer on five statistical techniques.
以下是五种统计技术的入门。
1)Z得分 (1) Z-score)
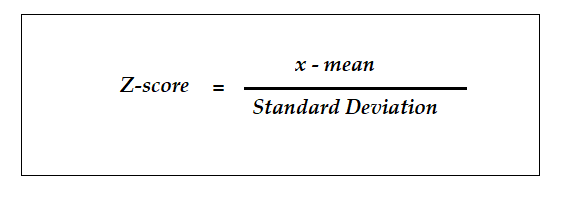
Z-score is probably the simplest one yet an useful statistical measure for anomaly detection. In a statistical distribution, Z-score tells you how far is a given data point from the rest of the crowd. Technically speaking, Z-score measures how many standard deviations away a given observation is from the mean. A Z-score of 2 means that the data point is 2 standard deviation far from the mean.
Z评分可能是最简单的方法,也是用于异常检测的有用统计方法。 在统计分布中,Z得分告诉您给定数据点与其他人群的距离。 从技术上讲,Z分数可衡量给定观察值与平均值之间有多少标准偏差。 Z分数为2表示数据点与平均值之间相差2个标准差。
To calculate Z-score you only need two parameters: mean and standard deviation, and they are fairly easy to get in any programming language (for example in Python you just apply the functiondescribe() to a data frame).
要计算Z分数,您只需要两个参数:均值和标准差,它们在任何编程语言中都相当容易获得(例如,在Python中,您只需将describe()函数应用于数据框)。
Once these two parameters are obtained, Z-score for any given data point is calculated using the following simple formula:
一旦获得这两个参数,就可以使用以下简单公式计算任何给定数据点的Z分数:
2)改良的Z分数 (2) Modified Z-score)
Z-score is easy to calculate using mean and standard deviation, but it has its own limitations. There are a few situations when it’s not an ideal technique, for example:
Z值很容易使用均值和标准差进行计算,但是它有其局限性。 在某些情况下,它不是理想的技术,例如:
- the data are not normally distributed 数据不是正态分布
- data/sample size is small数据/样本量小
In addition to these, Z-score is sensitive to extreme values (because one of its parameters — mean — itself is sensitive to extreme values), so it may fail to screen outliers appropriately.
除此之外,Z分数对极端值敏感(因为其参数之一(平均值)本身对极端值敏感),因此它可能无法适当地筛选异常值。
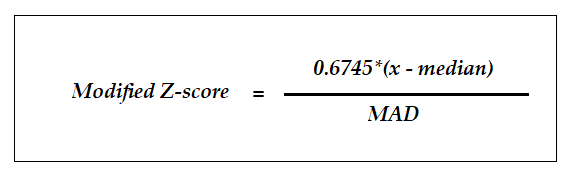
To overcome these shortcomings, several modifications are made to the standard Z-score:
为了克服这些缺点,对标准Z分数进行了一些修改:
- median is used instead of the mean as a parameter, since the median is less sensitive to outliers 使用中位数代替平均值作为参数,因为中位数对异常值不敏感
- Median Absolute Deviation (MAD) is used in lieu of standard deviation使用中位数绝对偏差(MAD)代替标准偏差
- The values are multiplied by a constant so that it is approximately equal to SD (for normally distributed data, MAD is approximately equal to 0.6745*SD)将值乘以一个常数,使其近似等于SD(对于正态分布的数据,MAD近似等于0.6745 * SD)
Putting them all together, the equation looks like the following:
将它们放在一起,等式如下所示:
3)四分位间距(IQR) (3) Interquartile Range (IQR))
If you arrange data from small to large, the mid-point is called the median. The median splits data into two halves. The mid-points of each of these halves is called a quartile.
如果您按从小到大的顺序排列数据,则中点称为中位数。 中位数将数据分为两半。 这两个半部分的中点称为四分位数。
In other words, you can split data into 3 quartiles — 1st, 2nd and 3rd (the 2nd quartile has a name for it— the median). So the Interquartile Range is the distance between 1st and 3rd quartiles. The theory behind anomaly detection using IQR is that, if a data point is too far from the 1st and 3rd quartile, it probably is an outlier.
换句话说,您可以将数据分成3个四分位数-第1个,第2个和第3个(第2个四分位数有一个名称-中位数) 。 因此,四分位数间距是第一四分位数与第三四分位数之间的距离。 使用IQR进行异常检测的理论依据是,如果数据点与第一个四分位数和第三个四分位数相距太远,则可能是异常值。
IQR can be used standalone for outlier detection, but boxplots below use the same algorithmic theory and are probably more intuitive than IQR.
IQR可以单独用于离群值检测,但是下面的箱线图使用相同的算法理论,并且可能比IQR更直观。
4)箱线图 (4) Boxplot)
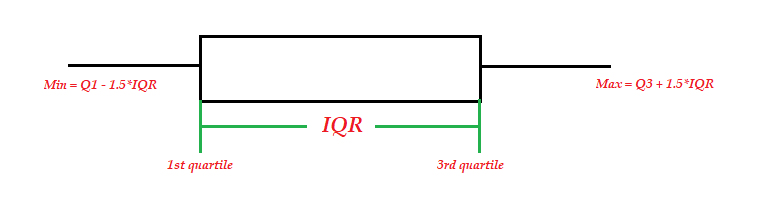
Boxplot provides a better graphical representation of IQR, but also provides additional information.
Boxplot提供了IQR的更好图形表示,但是还提供了其他信息。
In the boxplot below, the length of the box is IQR, and the minimum and maximum values are represented by the whiskers. The whiskers are generally extended into 1.5*IQR distance on either side of the box. Therefore, all data points outside these 1.5*IQR values are flagged as outliers.
在下面的方框图中,方框的长度为IQR,最小值和最大值由晶须表示。 晶须通常在盒子的任一侧延伸到1.5 * IQR距离。 因此,这些1.5 * IQR值之外的所有数据点都标记为离群值。
I wrote a separate article on boxplot for outlier detection with an example and a small snippet of Python, you might want to check that out.
我在boxplot上撰写了另一篇文章,用于离群值检测,并提供了一个示例和一小段Python代码,您可能需要检查一下。
5)直方图 (5) Histogram)
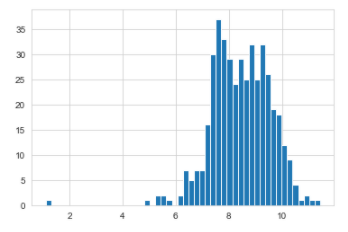
The final statistical tool for outlier detection is the distribution plot or histogram. It’s another way of tracking outliers both visually and programmatically. Take a look at the following figure for example:
用于离群值检测的最终统计工具是分布图或直方图。 这是在视觉和程序上跟踪异常值的另一种方法。 看下图为例:
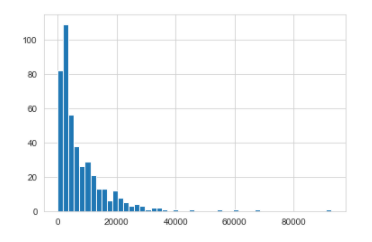
From this distribution plot alone it is pretty clear that while most values in the dataset are grouped together, there are quite a few values that seem to be out of the ordinary. So you could filter those values and check whether these are anomalies or not.
仅从此分布图就可以很清楚地看到,尽管数据集中的大多数值都被分组在一起,但仍有相当多的值似乎与众不同。 因此,您可以过滤这些值并检查它们是否为异常。
However, if the distribution of the data is skewed, sometimes you may need to apply data transformation techniques (e.g. logarithmic or square roots). For example, if we apply a logarithm to the same data as above, the data becomes approximately normally distributed and tells a different story about outliers.
但是,如果数据的分布不正确,有时您可能需要应用数据转换技术(例如对数或平方根)。 例如,如果我们将对数应用于与上述相同的数据,则数据将变为近似正态分布,并讲述有关异常值的不同故事。
概要(Summary)
The purpose of this article was to introduce five simple statistical techniques — z-score, modified z-score, IQR, boxplot and histogram — that are commonly used in data science as coarse filters for outlier/anomaly detection. Sometimes these simple techniques are good enough for anomaly detection, but sometimes we need to move on to more sophisticated machine learning algorithms — kNN, SVM, DBSCAN etc. — a subject of my future articles (stay tuned!).
本文的目的是介绍五种简单的统计技术-z分数,修改的z分数,IQR,箱线图和直方图,这些技术在数据科学中通常用作离群/异常检测的粗略过滤器。 有时这些简单的技术足以进行异常检测,但有时我们需要继续使用更复杂的机器学习算法(kNN,SVM,DBSCAN等),这是我未来文章的主题(敬请期待!)。
If you like my articles feel free to follow me on Twitter.
如果您喜欢我的文章,请随时在Twitter上关注我。
翻译自: https://towardsdatascience.com/statistical-techniques-for-anomaly-detection-6ac89e32d17a
统计方法进行异常检测


 被折叠的 条评论
为什么被折叠?
被折叠的 条评论
为什么被折叠?
 到【灌水乐园】发言


