


人口统计学可以告诉我们选民在大选中的政党选择 (What Demographics Can Tell Us About Voter’s Choice of Party in House Elections)
2017年美国国会众议院选举 (2017 Election for National House of Representatives)
Using data put together by Steve Riffe at data.world for the 2017 Election for the House of Representatives, I built a simple logistic regression model for predicting whether a voting district will a Democratic or Republican candidate based on its ethno-racial demographics. Riffe’s demographic data were taken from the US Census Bureau’s 2013 estimates.
我使用了史蒂夫·里夫 ( Steve Riffe)在2017年美国众议院选举中在data.world上汇总的数据,建立了一个简单的逻辑回归模型,用于基于其种族族裔人口统计预测投票区是民主党还是共和党候选人。 Riffe的人口统计数据取自美国人口普查局2013年的估算 。
The Census Bureau’s estimates use the following designations for the various ethno-racial groups:
人口普查局的估算为各个种族群体使用了以下名称:
- Hispanic 西班牙裔
- White 白色
- Black 黑色
- Native American 美洲原住民
- Asian 亚洲人
- Pacific Islander 太平洋岛民
- Other 其他
- Multiple Races 多种族
训练模型 (Training the Model)
After converting the data’s raw values to reflect each demographic as a percentage of the total estimated population of each district, I created a voter turnout feature. I do need to note here that, due to Riffe’s lack of clarity in the dataset’s data dictionary, it is not clear whether this feature represents actual voter turnout or simply the total number of votes the winning candidate received. The target category, the victorious candidates’ party affiliation, was then converted to binary values with Democrat = 0 and Republican = 1. Before my reader asks where all the independents went, surprisingly, there were none.
在转换数据的原始值以反映每个人口占每个地区总估计人口的百分比之后,我创建了一个投票者投票功能。 我确实需要在此指出,由于Riffe在数据集的数据字典中缺乏清晰度,因此尚不清楚此功能是代表实际选民投票率还是仅代表获胜候选人获得的总票数。 然后,将目标类别(胜利的候选人的政党隶属关系)转换为二进制值,其中民主党= 0,共和党=1。在我的读者询问所有独立人士去哪儿之前,令人惊讶的是,那里没有人。
I used with the scikit-learn implementation of logistic regression with a train, validate, test split to keep in line with best practices. This was a natural first choice given the fact that the question called for classification to solve. The model’s accuracy score was taken as the primary error metric over the Receiver-operator characteristic (ROC) score. The model measured against a mode-baseline accuracy score in which each district was predicted to elect a Republican representative. This decision was made given that the accuracy score is fairly interpret-able to the layman and the fact that the mode was roughly 55% meant that the ROC score was not needed to compensate for imbalanced classes.
我使用了逻辑回归的scikit-learn实现,并进行了训练,验证和测试拆分,以与最佳实践保持一致。 考虑到该问题需要分类来解决,因此这是自然的首选。 该模型的准确度得分被视为超过接收者-操作者特征(ROC)得分的主要误差指标。 该模型是根据模式基线准确度得分进行衡量的,其中预测每个地区都将选举一名共和党代表。 考虑到准确度分数对于外行来说是可以解释的,因此做出此决定是因为该模式大约为55%,这意味着不需要ROC分数来补偿班级不平衡。
Since the data were originally in alphabetical order by state name and sequentially by district number, I shuffled the data and performed a 70/15/15 train, val, test split. This was done in a SciKitLearn pipeline with StandardScaler as shown below.
由于数据最初是按州名按字母顺序排列的,而按区号依次按顺序排列,所以我对数据进行了混洗,并进行了70/15/15的火车,Val,测试拆分。 如下所示,这是在带有StandardScaler的SciKitLearn管道中完成的。
from sklearn.pipeline import make_pipelinefrom sklearn.linear_model import LogisticRegressionfrom sklearn.preprocessing import StandardScaler
lr = make_pipeline(
    StandardScaler(),
    LogisticRegression()
)
lr.fit(X_train, y_train)
lr_accuracy_ = lr.score(X_val, y_val)
This simple model netted 84.62 % accuracy, nearly 30% greater than the baseline.
这个简单的模型获得84.62%的准确度,比基线高出近30%。
分析数据 (Analyzing the Data)
Logit功能 (The Logit Function)
Given that the above model was sufficiently accurate to draw conclusions from, I used the the intercept and coefficients of the logit function, the linear form of the sigmoid logistic function, to see how each group contributed to the outcome of their districts choice of candidate. Each coefficient was then converted to a probability for facility of interpretation. The process and these data are shown below:
鉴于上述模型足够准确,可以得出结论,因此,我使用了logit函数的截距和系数(S型logistic函数的线性形式)来查看每个组如何对他们的地区选择候选人做出贡献。 然后将每个系数转换为便于解释的概率。 该过程和这些数据如下所示:
import mathlr_model = lr.named_steps['logisticregression']lr_coef = list(lr_model.coef_[0])
lr_coef_data = {'Feature' : features, 'Coefficients' : lr_coef}
lr_coefficients = pd.DataFrame(lr_coef_data)
lr_coefficients = lr_coefficients.sort_values(by = 'Coefficients',
                                              ascending = False)probabilities = []def log_odds_to_prob(coefficient):
  numerator = math.e ** coefficient
  denominator = 1 + numeratorreturn numerator / denominatorfor coefficient in lr_coefficients.Coefficients:
  probabilities.append(log_odds_to_prob(coefficient))
lr_coefficients['Probabilities'] = probabilities
lr_coefficients
The sign of the coefficients represents the direction that each feature pushes the vote in with positive values indicating a benefit for the Republicans and negative values indicating a benefit for the Democrats. The probabilities indicate the likelihood that a district composed entirely of the selected demographic would have a Republican representative. In the case of the voter turnout category — assuming that is the correct interpretation of the feature — the probability indicates the likelihood of a randomly selected district anywhere in the nation electing a Republican candidate given a 100% voter turnout. Given that only data from a single year, 2017, is being examined here, it would be prudent not to jump to any hasty conclusions. Even with 100% voter turnout, a Republican candidate would likely still stand a strong chance of winning given that the probability is close to 0.5. If we had analyzed data over a longer time span, we can safely presume that the value would come closer to 0.5. Given that the intercept of the logit function was 0.11225385011865346, or 0.5280340308125522 when expressed as a probability, it can be ignored and the above interpretation is still valid, even when examining the year 2017 alone.
系数的符号表示每个功能推动投票的方向,正值表示对共和党人有利,而负值表示对民主党人有利。 概率表明,完全由所选人口组成的一个地区将有共和党代表的可能性。 在选民投票率类别的情况下(假设这是对功能的正确解释),该概率表示在100%选民投票率的情况下,在全国任何地方随机选择的地区选举共和党候选人的可能性。 鉴于此处仅检查了2017年的年度数据,因此请谨慎考虑,不要得出任何仓促的结论。 即使有100%的选民投票率,鉴于该概率接近0.5,共和党候选人仍然有很大的获胜机会。 如果我们分析了较长时间的数据,则可以安全地假定该值将接近0.5。 假设以概率表示时logit函数的截距为0.11225385011865346或0.5280340308125522,则可以忽略不计,并且即使仅检查2017年,上述解释仍然有效。
What the data do tell us, however, can be extremely insightful. Being mindful of the fact that the coefficients tell us the relationship between the percentage of each ethno-racial group has and an elected official’s party affiliation, we find that states where the percentage of Whites and Native Americans is the highest tend to elect Republican Representatives. This does not indicate that the latter group, being a minority, actually votes Republican; rather, it tells us that the states with the highest per capita American Indian populations tend to be in the west. An example of this would be Arizona, a red state which also happens to be home to the Navajo Nation. Nor does this finding indicate that the former group predominantly votes Republican; rather, those Whites who live in states in which a larger proportion of the population is white do.
但是,数据告诉我们的内容可能非常有见地。 考虑到系数可以告诉我们每个民族的比例与民选党派之间的关系,我们发现白人和美洲原住民比例最高的州倾向于选举共和党代表。 这并不表示后者是少数派,实际上是对共和党投了赞成票; 相反,它告诉我们人均美洲印第安人人口最多的州往往在西方。 一个例子就是亚利桑那州,这是一个红色州,也恰好是纳瓦霍族的故乡。 这一发现也没有表明前者主要是共和党。 相反,那些居住在白人人口比例较高的州的白人确实如此。
Note also the magnitude to which the percentage of Pacific Islanders seem to influence the direction of the vote. This is likely due to the fact that Hawaii is the only state with a majority Pacific Islander population, and Hawaii just happens to be a Democratic-run state. Given that the largest Pacific Islander populations on the US mainland are found in Utah and the Carolinas, it’s likely that the trend would run in the opposite direction if Hawaii were omitted from the data.
另请注意,太平洋岛民所占百分比似乎会影响投票方向。 这很可能是由于夏威夷是太平洋岛民人口最多的唯一州,而夏威夷恰好是一个由民主管理的州。 考虑到美国大陆上最大的太平洋岛民人口位于犹他州和卡罗来纳州,如果从数据中省略夏威夷,则趋势可能会朝相反的方向发展。
In my opinion, quite possibly the most fascinating finding here is the indication that states with higher percentages of people who choose to check the “Other” box on the Census, tend to elect Democratic candidates. This may simply be because coastal areas and large cities tend to have more diverse populations, or it may be something more curious.
我认为,最令人着迷的发现很可能表明,选择在人口普查中选择“其他”框的人比例较高的州倾向于选举民主党候选人。 这可能仅仅是因为沿海地区和大城市的人口趋于多样化,或者可能是出于某种原因。
排列重要性 (Permutation Importances)
Calculating the permutation importances, another statistical tool which examines the effect which each features has on the target, the magnitude of this effect seems to dwarf the other categories’ influence.
计算排列的重要性,这是另一个统计工具,它检查每个特征对目标的影响,这种影响的程度似乎使其他类别的影响相形见war。
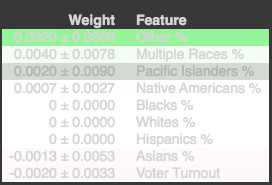
The permutation importance algorithm calculates a weight for each feature’s contribution to the target variable. Unlike the logit function’s intercept and coefficients, here sign indicates the magnitude rather than the effect of those contributions. Taking these weights into our analysis, all categories except Other, Multiple Races, Pacific Islanders, and Native Americans contributions can effectively be discounted, with the Other being the only definite contributor to the net result. This is strong evidence for the diversity theory described above.
排列重要性算法计算每个特征对目标变量的贡献的权重。 与logit函数的截距和系数不同,这里的符号表示这些贡献的大小而不是影响。 将这些权重纳入我们的分析中,除“ 其他”,“多个种族”,“太平洋岛民”和“ 美洲原住民”以外的所有类别都可以有效地折现,“ 其他”是最终结果的唯一确定贡献者。 这是上述多样性理论的有力证据。
翻译自: https://medium.com/@samswank/democrat-or-republican-politics-and-logistic-regression-7639648be5f0


 被折叠的 条评论
为什么被折叠?
被折叠的 条评论
为什么被折叠?
 到【灌水乐园】发言


