


 本文详细介绍了将费用数据导入Google Analytics的四种方法:通过GA界面手动导入,使用Google表格插件,利用API和Apps脚本半自动导入,以及通过特殊服务自动导入。每种方法都有详细的步骤说明,适合不同需求的用户。导入数据时,UTM标签的正确使用至关重要,以确保数据准确无误。
If you use multiple ad services and platforms to advertise your products, it’s a good idea to combine all ad data in a single interface. This brings some huge advantages:
如果您使用多种广告服务和平台来宣传您的产品,则最好将所有广告数据合并到一个界面中。 这带来了一些巨大的优势:
Saves time. You don’t need to eternally switch between Google Ads, Facebook, Instagram, and other services to evaluate the efficiency of advertising efforts.
节省时间。 您无需在Google Ads,Facebook,Instagram和其他服务之间进行永久切换即可评估广告工作的效率。
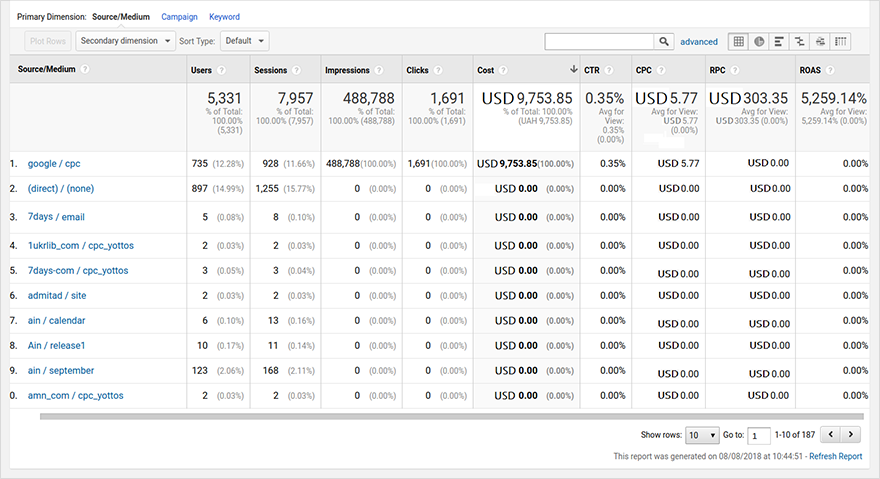
2. Lets you compare the performance of all services in one system.In addition to cost data, you can send additional information from ad services to Google Analytics to deeply analyze your campaigns, ads, and keywords. You can use this data to decide if your channels pay off and reallocate your budget by comparing views, ad costs, CTR, and ROAS for all traffic sources.
2.让您比较一个系统中所有服务的性能。 除了费用数据外,您还可以将广告服务中的其他信息发送到Google Analytics(分析),以深入分析广告系列,广告和关键字。 您可以通过比较所有流量来源的观看次数,广告费用,点击率和广告支出回报率,来使用这些数据来确定您的渠道是否能获得回报并重新分配预算。
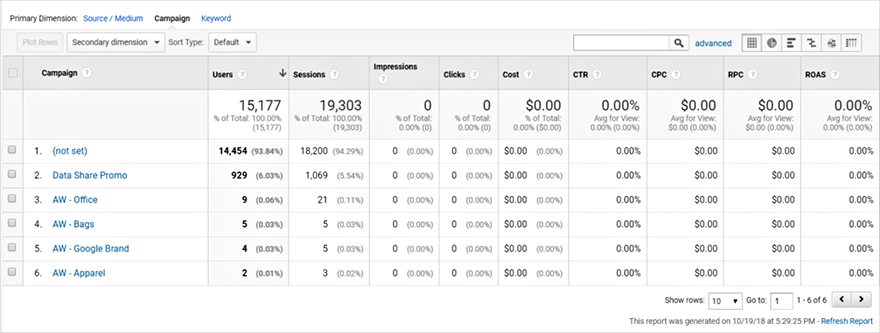
You can see this data in GA reports by going to Acquisition — Campaigns — Cost Analysis.
您可以转到GA-营销活动-成本分析在GA报告中查看此数据。
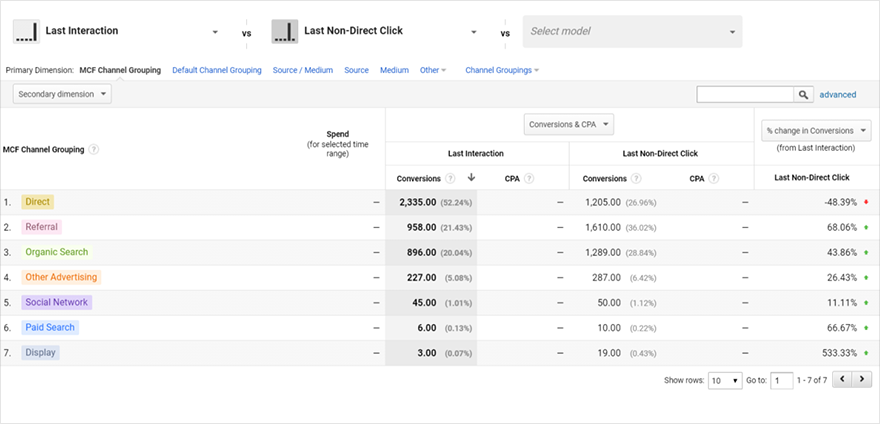
3. Lets you use additional features of Google Analytics. If you import cost data to Google Analytics, you can use it in different attribution models and compare calculation results along with ROI to properly credit your marketing channels.
3.让您使用Google Analytics(分析)的其他功能。 如果您将费用数据导入Google Analytics(分析),则可以在不同的归因模型中使用它,并将计算结果与投资回报率进行比较,以正确地计入您的营销渠道。
These results also can be tracked in GA: Conversions — Attribution — Model Comparison Tool.
这些结果也可以在Google Analytics(分析)中进行跟踪:转化-归因-模型比较工具。
如何将费用数据导入Google Analytics(分析)(How to import cost data to Google Analytics)
It’s quite easy to import cost data from Google Ads (formerly AdWords) to GA as there’s a native integration between these two services. To export cost data from other ad services, you can do one of the following:
将费用数据从Google Ads(以前称为AdWords)导入到Google Analytics(分析)非常容易,因为这两种服务之间存在本机集成。 要从其他广告服务中导出费用数据,您可以执行以下操作之一:
- Manually import via the GA interface. 通过GA接口手动导入。
- Import with a special add-on for Google Sheets. 导入带有适用于Google表格的特殊加载项。
- Use semi-automatic import with the API and Google Apps Script. 通过API和Google Apps脚本使用半自动导入。
- Use an out-of-the-box solution. 使用开箱即用的解决方案。
We’ll take a closer look at the options that don’t require any assistance from IT specialists (like the API alternative) so you can learn more about how to import cost data in GA and using out-of-the-box solutions.
我们将仔细研究不需要IT专家任何帮助的选项(例如API替代项),以便您了解更多有关如何在GA中导入费用数据以及如何使用即用型解决方案的信息。
Please note that all four options we’ve mentioned require proper proper UTM tags in your campaigns:
请注意,我们提到的所有四个选项都需要在您的广告系列中使用正确的UTM标签:
- Required: utm_source, utm_medium, utm_campaign. 必需:utm_source,utm_medium,utm_campaign。
- Optional: utm_term, utm_content. 可选:utm_term,utm_content。
Once users click on links to your site, the values from the UTM tags are sent to Google Analytics.
用户单击指向您网站的链接后,UTM标记中的值将发送到Google Analytics(分析)。
1.通过Google Analytics(分析)导入费用数据 (1. Import cost data through Google Analytics)
With this method, you have to fill out a CSV file with the data from your ad service and upload it manually to Google Analytics every time you need a report. If you have two or three channels and you want the data on them every month, this manual method is fine. But when it comes to dozens of channels, it gets really complicated and time-consuming.
使用这种方法,您必须使用广告服务中的数据填写CSV文件,并在每次需要报告时将其手动上传到Google Analytics(分析)。 如果您有两个或三个通道,并且每个月都希望获得有关这些通道的数据,则此手动方法很好。 但是,当涉及到数十个频道时,它变得非常复杂且耗时。
There are three steps to import cost data to Google Analytics.
将费用数据导入Google Analytics(分析)的过程分为三个步骤。
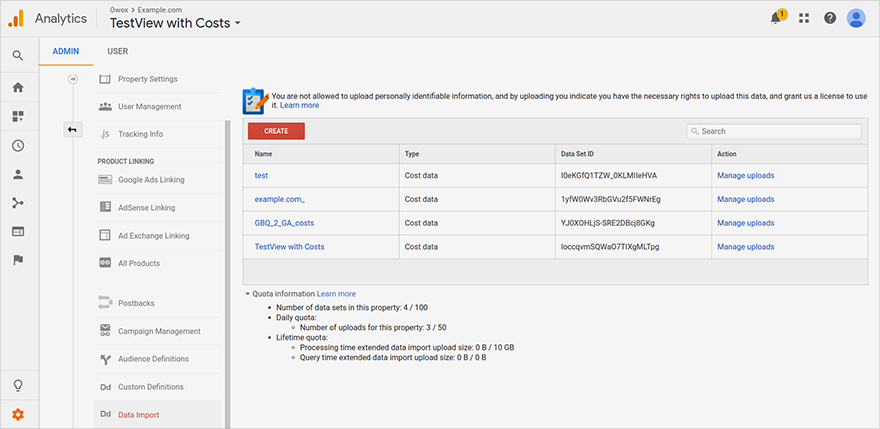
步骤1.在Google Analytics(分析)中创建数据集。 (Step 1. Create a data set in Google Analytics.)
Go to the Admin panel — Data Import — Create:
转到管理面板-数据导入-创建:
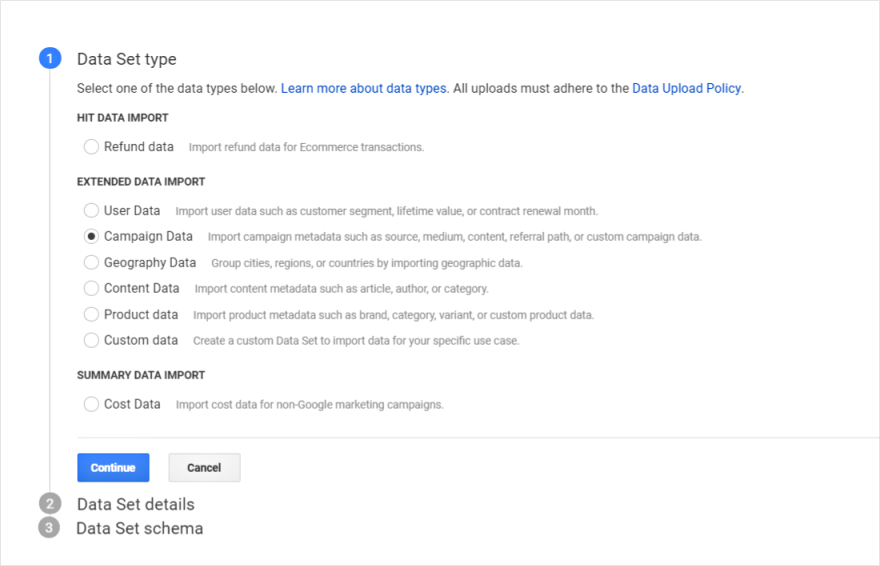
Then choose Cost Data and click Continue:
然后选择成本数据,然后单击继续:
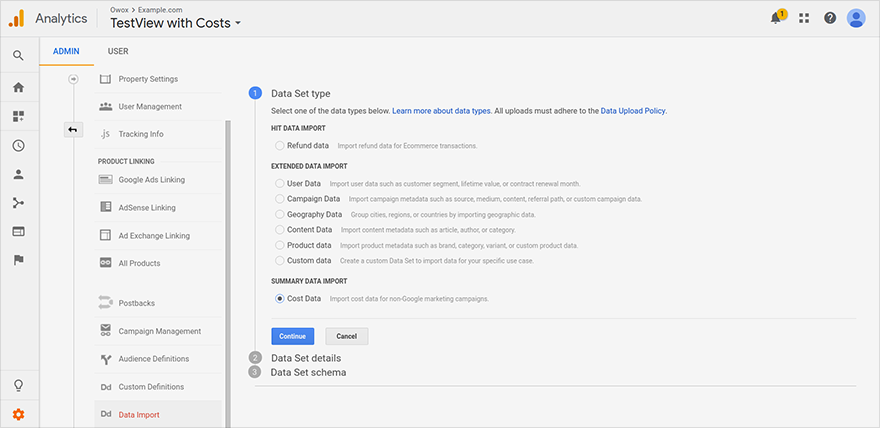
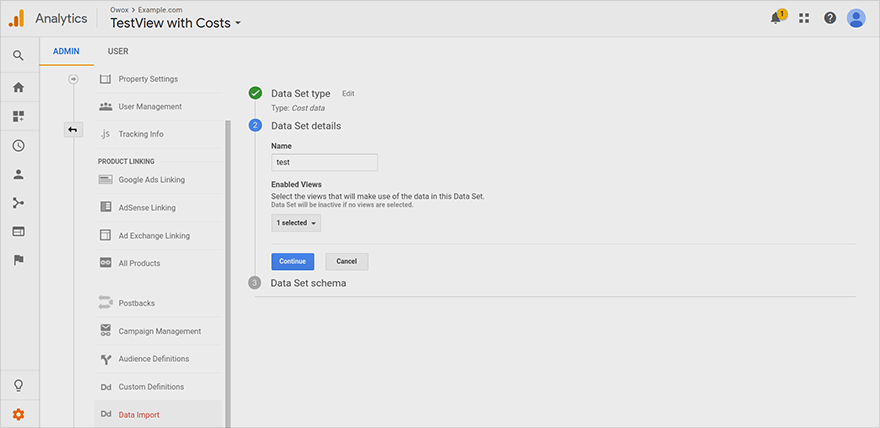
Name your data set and choose the GA view to upload cost data to. Click Continue:
为您的数据集命名,然后选择GA视图以将成本数据上传到其中。 点击继续:
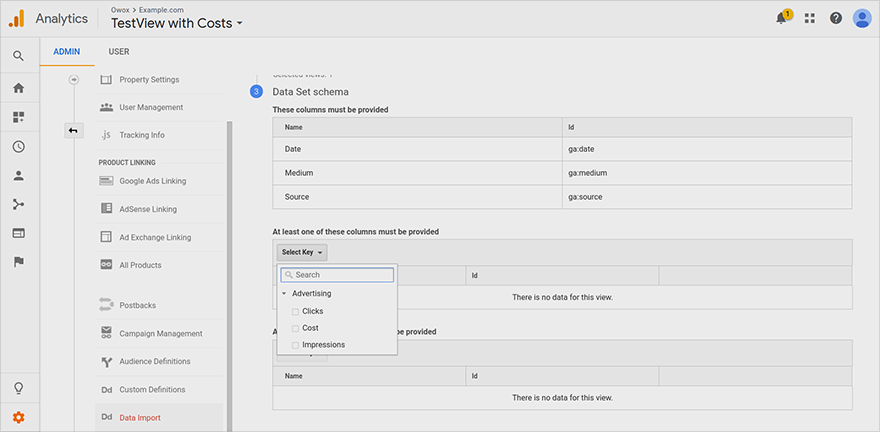
Now determine the data set structure by choosing the parameters to export from the ad service to Google Analytics. There are three required fields, which are filled automatically: Date, Source, and Medium. There’s also a set of fields that require at least one parameter: Clicks, Cost, and Impressions.
现在,通过选择要从广告服务导出到Google Analytics(分析)的参数来确定数据集结构。 有三个必填字段,它们是自动填写的:日期,来源和中。 还有一组字段至少需要一个参数:点击次数,费用和展示次数。
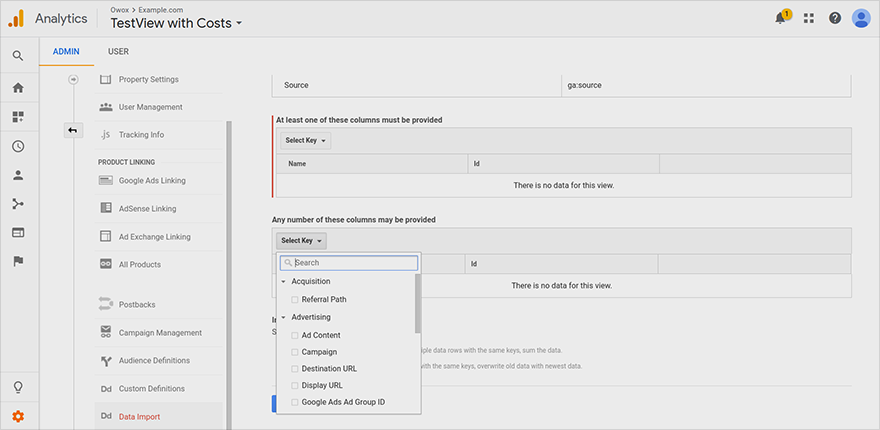
The third set of fields is optional. Here you can add any extra information you collect with UTMs — for instance, keywords or ad content.
第三组字段是可选的。 您可以在此处添加使用UTM收集的所有其他信息,例如关键字或广告内容。
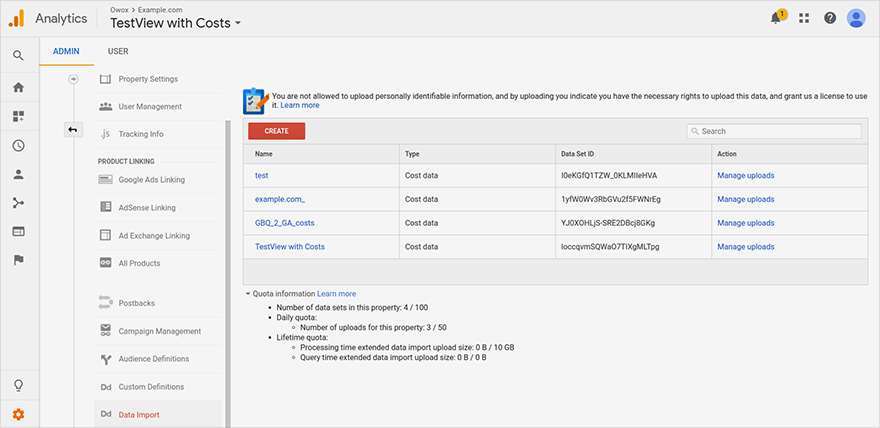
Under Import Behavior, choose what you want to do when imported data is repeated, for example when keywords are already uploaded to GA. If you want to add the new data to the existing data, choose Summation. If you want the existing data to be replaced with the new data, choose Overwrite. Next, save the changes and you’ll see a new data set in the Data Importmenu:
在“导入行为”下,选择重复导入数据(例如,关键字已上传到Google Analytics(分析))时要执行的操作。 如果要将新数据添加到现有数据中,请选择汇总。 如果要将现有数据替换为新数据,请选择覆盖。 接下来,保存更改,您将在“数据导入”菜单中看到一个新的数据集:
步骤2.创建一个要上传的CSV文件。(Step 2. Create a CSV file to upload.)
Once you’ve created the data set, you need to prepare a CSV file, fill it with your data on cost, clicks, and other metrics from the ad service, and upload it to Google Analytics. Don’t forget to stick to the same data structure in the CSV file as in the data set from step 1. You can read more about how to properly build a file for uploading cost data in Google Analytics Help.
创建数据集后,您需要准备一个CSV文件,并用广告服务中的费用,点击次数和其他指标填充数据,然后将其上传到Google Analytics(分析)。 别忘了在CSV文件中坚持使用与第1步中的数据集相同的数据结构。您可以在Google Analytics(分析)帮助中了解有关如何正确构建文件以上传费用数据的更多信息。
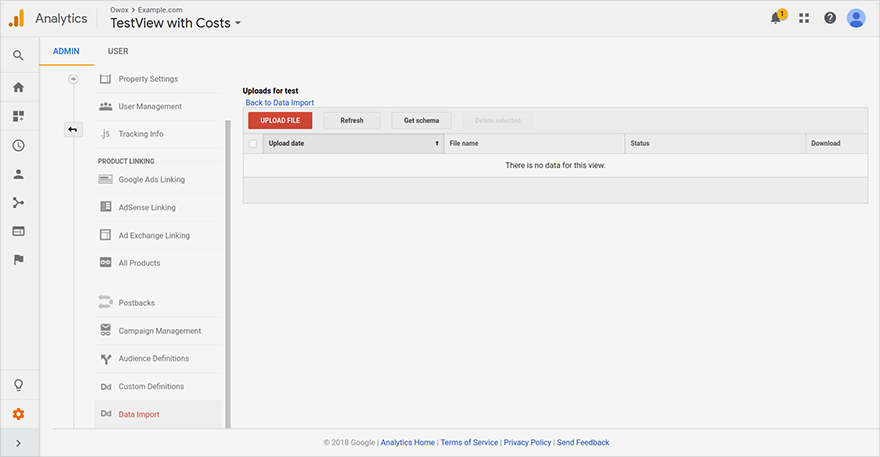
步骤3.将CSV文件上传到Google Analytics(分析)。 (Step 3. Upload the CSV file to Google Analytics.)
At this point, your data has been collected and the CSV file is ready. Now it’s time to send it to GA. To do that, navigate back to Data Import and click on Upload File:
至此,您的数据已经收集到,并且CSV文件已准备就绪。 现在是时候将其发送到GA。 为此,请导航回“数据导入” ,然后单击“上载文件” :
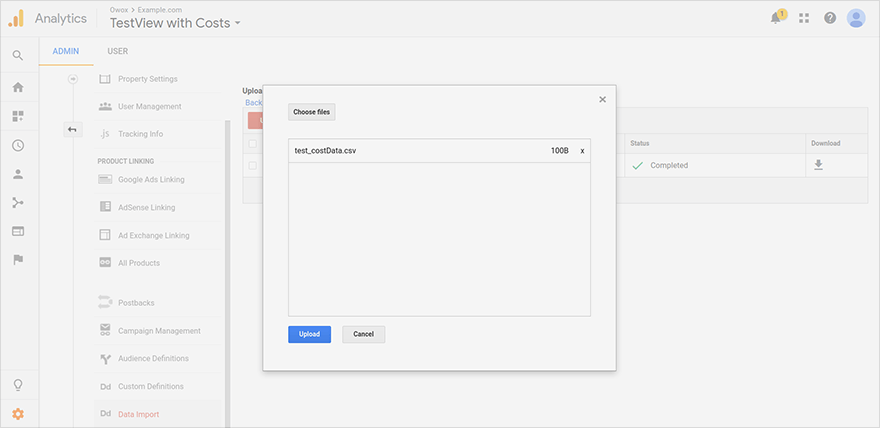
Select the CSV file with the cost data on your computer and confirm the Upload:
在计算机上选择包含费用数据的CSV文件,然后确认Upload :
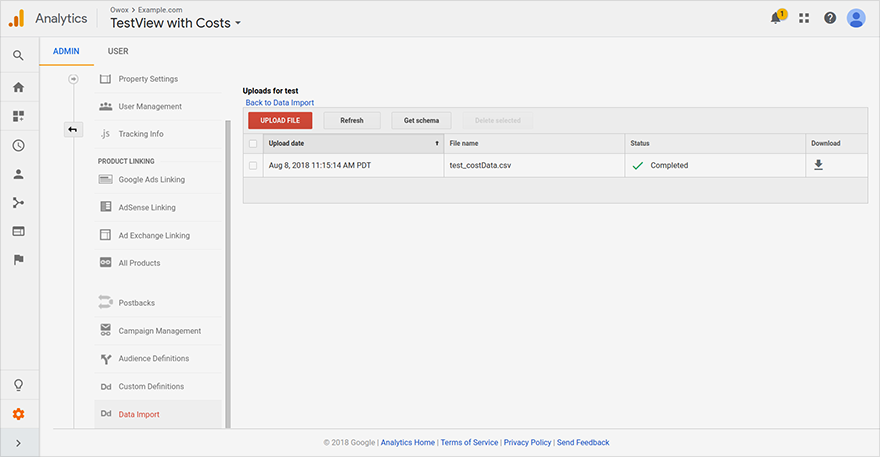
If the CSV file was filled correctly, you’ll see that the status is Completed. It will take about 24 hours to process the data and to add it to your reports.
如果CSV文件已正确填充,您将看到状态为“已完成”。 处理数据并将其添加到报告中大约需要24小时。
If you see an error when importing the data, check out possible issues and solutions in Google Analytics Help.
如果在导入数据时看到错误,请在Google Analytics(分析)帮助中查看可能的问题和解决方案。
2.使用Google表格插件导入费用数据 (2. Import cost data using the Google Sheets add-on)
If you already collect cost data in Google Sheets, you can avoid the hassle with CSV files. Just use the free OWOX BI Data Upload Add-on and send your cost data from Google Sheets to Google Analytics directly. If there are any mistakes in the uploaded data, the add-on will suggest how to correct them.
如果您已经在Google表格中收集了费用数据,则可以避免CSV文件带来的麻烦。 只需使用免费的OWOX BI数据上传插件,然后将费用数据从Google表格直接发送到Google Analytics(分析)即可。 如果上传的数据中有任何错误,该附件将建议如何更正它们。
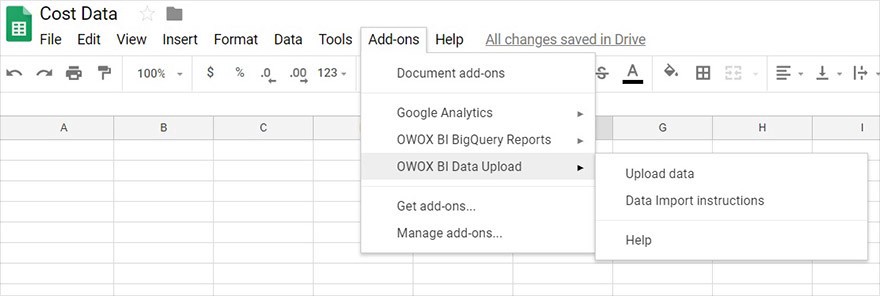
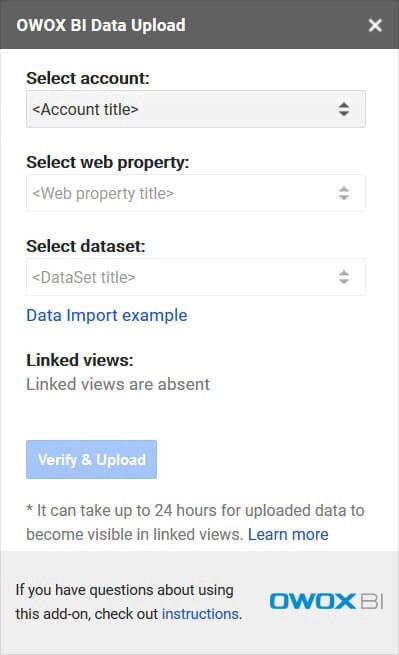
To import data with the OWOX BI Data Upload Add-on, you need to create a data set in GA, and download and install the add-on. Next, open a properly structured cost data table (like the data set in GA, and click on Add-ons — OWOX BI Data Upload — Upload data:
要使用OWOX BI数据上传加载项导入数据,您需要在GA中创建一个数据集,然后下载并安装该加载项。 接下来,打开一个结构合理的成本数据表(例如GA中的数据集,然后单击附加组件-OWOX BI数据上传-上传数据:
Then choose the account, web property, and data set in GA to which you would like to upload costs and click Verify & Upload.
然后在Google Analytics(分析)中选择您要向其上传费用的帐户,网络载体和数据集,然后点击验证并上传。
Sweet, in 24 hours you’ll see the added data in GA reports.
亲爱的,您会在24小时内在Google Analytics(分析)报告中看到添加的数据。
3.使用API和Apps脚本导入费用数据 (3. Use the API and Apps Script to import cost data)
This data import option is semi-automatic. Here’s how to set it up: create a data set in GA along with a cost data table in Google Sheets, and Google Apps Script will do the rest. Check out this guide to learn more about importing via the API.
此数据导入选项是半自动的。 设置方法如下:在Google Analytics(分析)中创建一个数据集以及在Google表格中创建一个费用数据表,其余的工作将由Google Apps脚本完成。 查看本指南,以了解有关通过API导入的更多信息。
Keep in mind the drawbacks of this option, however:
但是请记住此选项的缺点:
- There are tons of ready-made scripts, but you have to configure them and know the correct App Script syntax to use them. 有大量现成的脚本,但是您必须对其进行配置,并且知道正确的App Script语法才能使用它们。
- You’ll have to collect data in Google Sheets manually or through another API and App Script, or even using special services. 您必须手动或通过其他API和应用脚本,甚至使用特殊服务来收集Google表格中的数据。
- There’s a certain format you have to stick to or else you’ll see errors or uncertainties in your data. 您必须遵守某种格式,否则您将看到数据中的错误或不确定性。
4.通过特殊服务自动导入成本数据 (4. Importing cost data automatically via special services)
Most Ecommerce projects use other ad platforms along with Google Ads. Therefore, these projects have to track their costs carefully to quickly react and reallocate their marketing budgets. This is why uploading data manually is surely too time-consuming. But there are tools to solve this problem and help marketers and analysts get rid of routine work. Here’s our solution for this problem, which we call OWOX BI Pipeline.
大多数电子商务项目都与Google Ads一起使用其他广告平台。 因此,这些项目必须仔细跟踪其成本,以快速做出React并重新分配其营销预算。 这就是为什么手动上载数据肯定很费时的原因。 但是,有一些工具可以解决此问题,并帮助营销人员和分析师摆脱日常工作。 这是我们针对此问题的解决方案,我们称之为OWOX BI Pipeline 。
Currently, you can use BI Pipeline to automatically import data to GA from Facebook, Instagram, LinkedIn, Criteo, Yandex.Direct, Yandex.Market, MyTarget, AdRoll, Trafmag, Bing Ads, Twitter Ads, Sklik, Outbrain, Yahoo Gemini, and Hotline.
当前,您可以使用BI Pipeline自动将数据从Facebook,Instagram,LinkedIn,Criteo,Yandex.Direct,Yandex.Market,MyTarget,AdRoll,Trafmag,Bing Ads,Twitter Ads,Sklik,Outbrain,Yahoo Gemini和热线。
OWOX BI can also expand shortened links, recognize dynamic parameters in ad campaigns, check UTM tags, and notify you of any mistakes in tags. And the cherry on top is that Pipeline converts the currency of the ad service you use to the one in GA.
OWOX BI还可以扩展缩短的链接,识别广告系列中的动态参数,检查UTM标签,并在标签中出现任何错误时通知您。 最重要的是,管道将您使用的广告服务的货币转换为Google Analytics(分析)中的一种。
If you need to analyze data for a previous period, you can set up a special option in OWOX BI settings to get historical data from GA for the past six months.
如果您需要分析前一时期的数据,则可以在OWOX BI设置中设置一个特殊选项,以从GA获取过去六个月的历史数据。
Moreover, Pipeline retrospectively updates the data uploaded to GA (for up to 21 days) if there are any changes in the data of the ad service. Interested yet? You can try all of these features for free during the 7-day trial period.
此外,如果广告服务的数据发生任何变化,则Pipeline会追溯更新上传到Google Analytics(分析)的数据(最多21天)。 有兴趣吗? 您可以在7天的试用期内免费试用所有这些功能。
But enough about the advantages of BI Pipeline. Let’s talk about how to use it. You’ll first need a data set in GA and then set up OWOX BI Pipeline.
但是关于BI Pipeline的优势已经足够了。 让我们谈谈如何使用它。 您首先需要在GA中设置数据集,然后设置OWOX BI Pipeline。
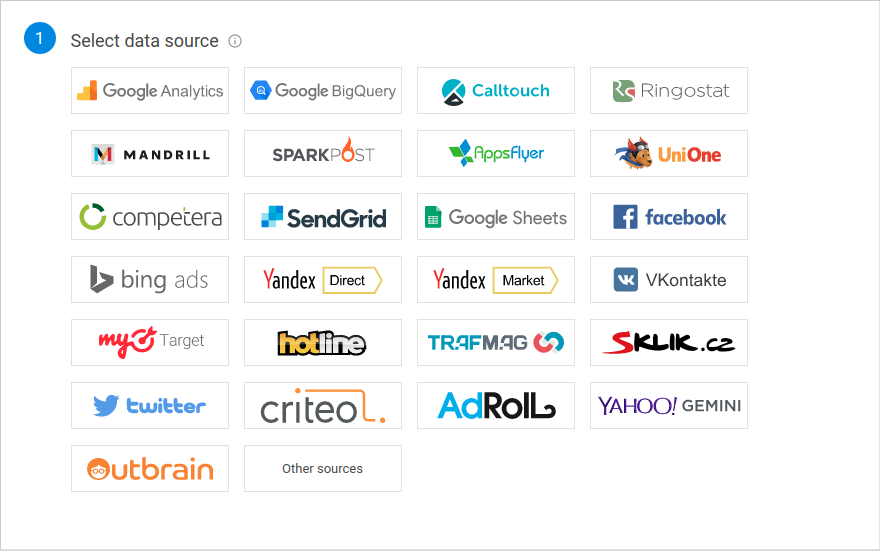
If you haven’t got an OWOX BI project, set it up using your Google account. Then navigate to Pipeline, create a pipeline and select the data source:
如果您还没有OWOX BI项目,请使用您的Google帐户进行设置。 然后导航到Pipeline ,创建管道并选择数据源:
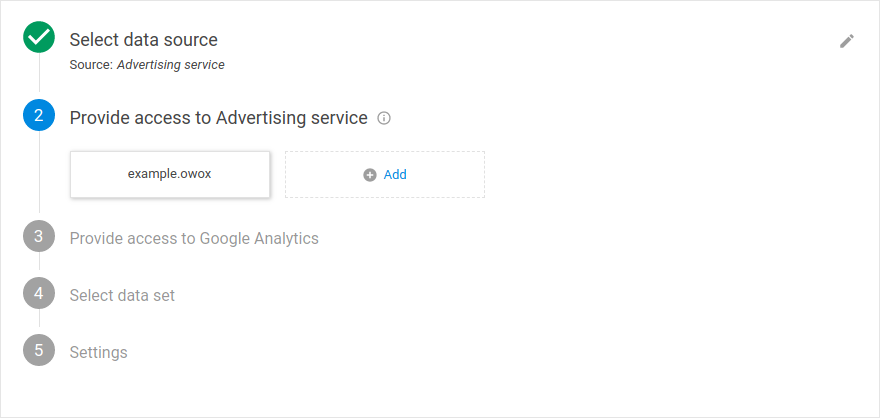
Next, provide access to the advertising service:
接下来,提供对广告服务的访问权限:
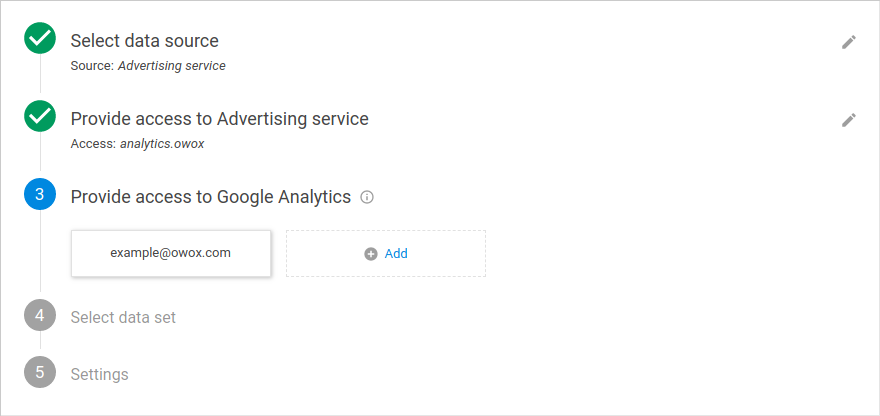
And provide access to your Google Analytics account:
并提供对您的Google Analytics(分析)帐户的访问权限:
Select the data set in Google Analytics to upload cost data:
在Google Analytics(分析)中选择数据集以上传费用数据:
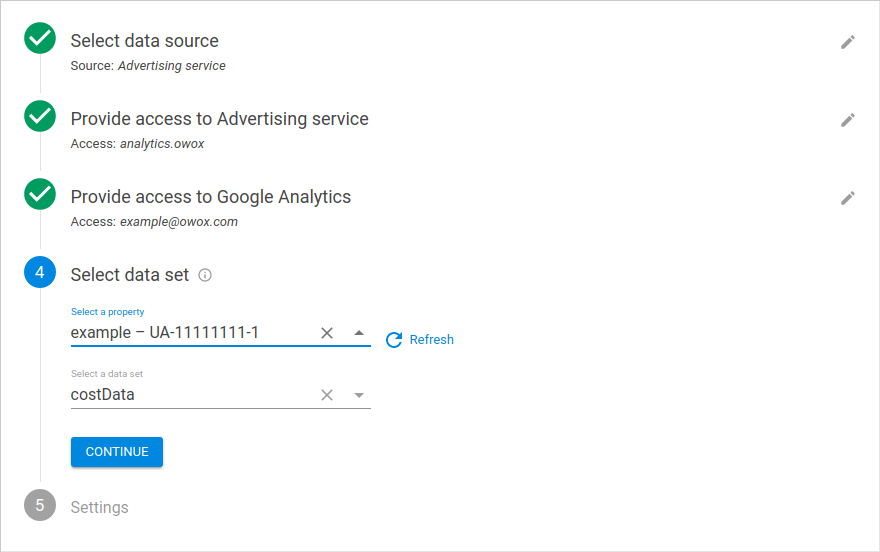
Now set the starting date for importing data (by default, it’s the current date). You can change this to a past or future date. Now select a view and click Create:
现在设置导入数据的开始日期(默认情况下,它是当前日期)。 您可以将其更改为过去或将来的日期。 现在选择一个视图并单击创建:
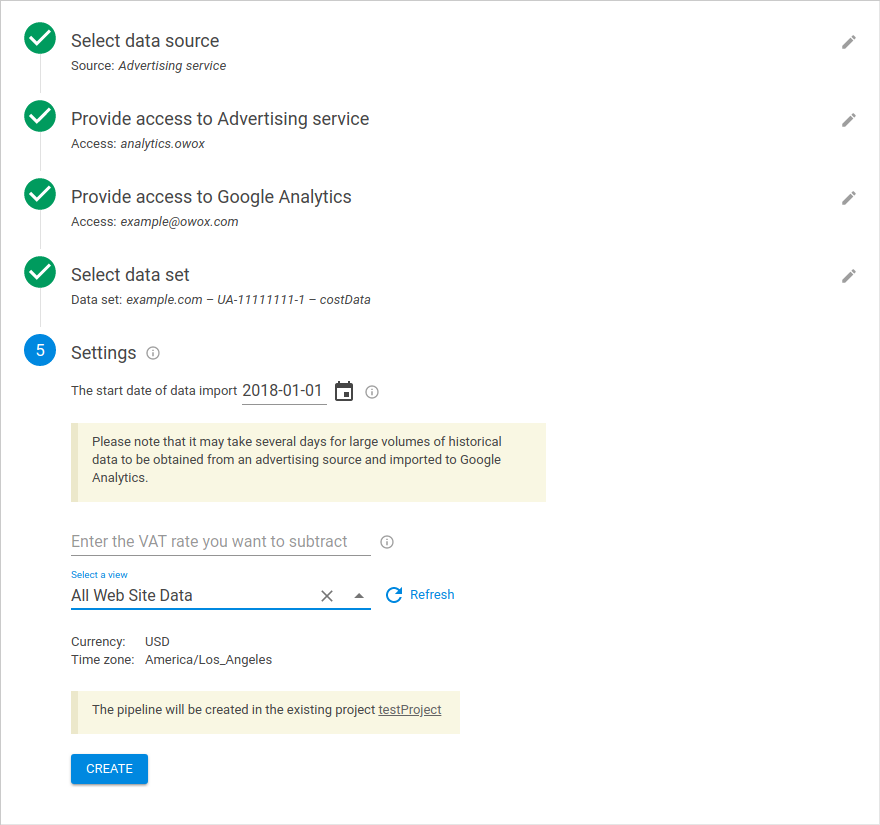
Ta da! The pipeline is set and ready. The data will be available in GA reports in about 36 hours. It takes up to 12 hours for OWOX BI to process the data and up to 24 hours for GA to process it.
da! 管道已准备就绪。 该数据将在约36小时内显示在Google Analytics(分析)报告中。 OWOX BI最多需要12个小时来处理数据,GA最多需要24个小时来处理数据。
常问问题 (F.A.Q.)
如果我只需要单个广告系列的数据怎么办?(What if I only need data on a single campaign?)
You can create a CSV file with the data from this campaign and upload it manually to GA. Automatic import will only let you upload data on multiple campaigns. Though, you can set up filters to see the information on the campaign you need. To do that, choose the Campaign parameter when creating a data set in GA:
您可以使用此广告系列中的数据创建CSV文件,然后将其手动上传到GA。 自动导入只会让您在多个广告系列上上传数据。 不过,您可以设置过滤器以查看所需广告系列的信息。 为此,请在GA中创建数据集时选择Campaign参数:
After that, go to Acquisition — Campaigns — Cost Analysis and set Campaign as the primary dimension to see a report across campaigns.
之后,转到“获取-广告系列-成本分析”,然后将“广告系列”设置为主要维度,以查看各个广告系列的报告。
如果我需要的参数超出了GA中数据导入的范围,该怎么办?(What if I need more parameters than the data import in GA allows?)
If you need information that isn’t included in the cost data schema, you can collect and combine data from ad services in Google BIgQuery. OWOX BI Pipeline lets you send complete data to BigQuery from Facebook Ads (see the data schema).
如果您需要费用数据架构中未包含的信息,则可以从Google BIgQuery中的广告服务收集并合并数据。 OWOX BI Pipeline允许您从Facebook Ads向BigQuery发送完整的数据(请参阅数据模式)。
如何从未与OWOX BI Pipeline集成的来源向GA导入费用数据? (How can I import cost data to GA from sources that aren’t integrated with OWOX BI Pipeline?)
BI Pipeline uses the official APIs of ad services. For services that don’t provide an API or that aren’t integrated with OWOX BI, there’s a manual upload option. It’s different from the GA manual upload method as you don’t have to form and upload CSV files — you can do that in the OWOX BI interface.
BI Pipeline使用广告服务的官方API。 对于不提供API或未与OWOX BI集成的服务,有一个手动上载选项。 它与GA手动上传方法不同,因为您无需形成和上传CSV文件-您可以在OWOX BI界面中进行操作。
如何计算广告投资报酬率,并考虑GA以外的退款和已完成的订单? (How can I calculate ROAS and take into account refunds and completed orders that aren’t in GA?)
You’ll have to use BigQuery to merge data about completed orders from your CRM with data from ad services and GA. This will also allow you to set up a Funnel Based attribution model and evaluate your campaigns while accounting for offline orders.
您必须使用BigQuery将来自CRM的已完成订单的数据与来自广告服务和GA的数据合并。 这也将使您能够建立基于渠道的归因模型,并在评估离线订单的同时评估广告系列。
结论 (Conclusions)
To compare the performance of your ad channels, you need to collect data in a single system like Google Analytics. The best way to import your cost data depends on how many ad services you use and how often you need reports on them.
要比较广告渠道的效果,您需要在单个系统(例如Google Analytics(分析))中收集数据。 导入费用数据的最佳方法取决于您使用了多少个广告服务以及您需要多久一次关于它们的报告。
If you use two or three ad services and don’t need reports often, you can upload cost data to GA manually. Otherwise, consider using special services like OWOX BI to automatically upload cost data.
如果您使用两个或三个广告服务并且不经常需要报告,则可以手动将费用数据上传到Google Analytics(分析)。 否则,请考虑使用OWOX BI之类的特殊服务来自动上传成本数据。
翻译自: https://towardsdatascience.com/google-analytics-data-import-4-ways-8aeb8eb20738


 被折叠的 条评论
为什么被折叠?
被折叠的 条评论
为什么被折叠?
 到【灌水乐园】发言


