


假设检验python
Hypothesis testing is an important part of statistics and data analysis. Most of the time it is practically not possible to take data from a total population. In that case, we take a sample and make estimations or claims about the total population. These assumptions or claims are hypotheses. Hypothesis testing is the process to test if there is evidence to reject that hypothesis.
假设检验是统计和数据分析的重要组成部分。 在大多数情况下,实际上不可能从总人口中获取数据。 在这种情况下,我们将抽样并对总人口进行估算或索赔。 这些假设或主张是假设。 假设检验是检验是否有证据拒绝该假设的过程。
Hypothesis testing normally is done on proportion and mean.
假设检验通常按比例和均值进行。
In this article, we are going to cover the hypothesis testing of the population proportion, the difference in population proportion, population or sample mean and the difference in the sample mean.
在本文中,我们将介绍人口比例的假设检验,人口比例,人口或样本均值的差异以及样本均值的差异。
I will explain the process of hypothesis testing step by step for all the four categories individually with examples.
我将通过示例逐步说明所有四个类别的假设检验过程。
I used a Jupyter Notebook environment for this exercise. If you do not have that feel free to use any notebook or IDE of your choice.
我在本练习中使用了Jupyter Notebook环境。 如果没有,请随意使用您选择的任何笔记本电脑或IDE。
A Google collab notebook will be perfect too. Google collab is a smart notebook. These common libraries are preinstalled in it.
Google合作笔记本也将是完美的。 Google合作实验室是一款智能笔记本。 这些通用库已预先安装在其中。
假设检验的比例 (Hypothesis Testing for One Proportion)
This is the most basic hypothesis testing. Most of the time we do not have a specific fixed value for comparison. But if we have, this is the most simple hypothesis testing. I am going to start with a one proportion hypothesis testing.
这是最基本的假设检验。 大多数时候,我们没有特定的固定值用于比较。 但是,如果有的话,这是最简单的假设检验。 我将从一个比例假设检验开始。
I used the Heart dataset from Kaggle for this demonstration. Please feel free to download the dataset for your practice. Here I import the packages and the dataset:
我使用了Kaggle的Heart数据集进行了演示。 请随时下载数据集进行练习。 在这里,我导入包和数据集:
import pandas as pd
import numpy as np
import statsmodels.api as sm
import scipy.stats.distributions as distdf = pd.read_csv('Heart.csv')
df.head()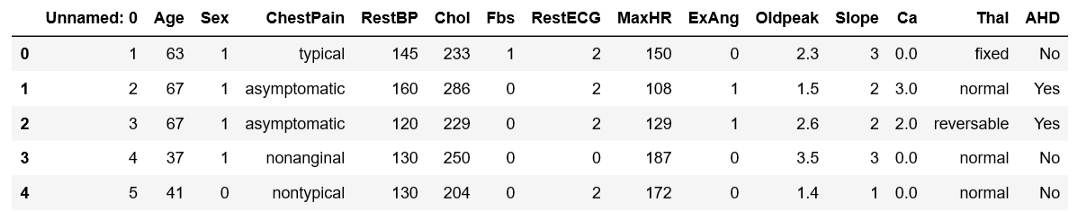
The last column of the dataset is ‘AHD’. That is if the person has heart disease. The research question for this section is,
数据集的最后一列是“ AHD”。 那就是如果这个人患有心脏病。 本节的研究问题是
“The population proportion of Ireland having heart disease is 42%. Are more people suffering from heart disease in the US”?
爱尔兰患有心脏病的人口比例为42%。 在美国,有更多的人患心脏病吗?
Now, find the answer to this research question step by step.
现在,逐步找到该研究问题的答案。
Step 1: define the null hypothesis and alternative hypothesis.
步骤1:定义原假设和替代假设。
In this problem, the null hypothesis is the population proportion having heart disease in the US is less than or equal to 42%. But if we test for equal to less than will be covered automatically. So, I am making it only equal to.
在这个问题中,零假设是在美国患有心脏病的人口比例小于或等于42%。 但是,如果我们测试的小于等于将自动覆盖。 因此,我使它仅等于。
And the alternative hypothesis is the population proportion of the US having heart disease is more than 42%.
另一种假设是,美国心脏病患者的比例超过42%。
Ho: p0 = 0.42  #null hypothesis
Ha: p > 0.42  #alternative hypothesis
Let’s see if we can find the evidence to reject the null hypothesis.
让我们看看是否可以找到拒绝原假设的证据。
Step 2: Assume that the dataset above is a representative sample from the population of the US. So, calculate the population proportion of the US having heart disease.
步骤2:假设上面的数据集是美国人口中的代表性样本。 因此,计算出患有心脏病的美国人口比例。
p_us = len(df[df['AHD']=='Yes'])/len(df)The population proportion of the sample having heart disease is 0.46 or 46%. This percentage is more than the null hypothesis. That is 42%.
患有心脏病的样本的人口比例为0.46或46% 。 该百分比大于零假设。 那是42%。
But the question is if it is significantly more than 42%. If we take a different simple random sample, the currently observed population proportion (46%) can be different.
但是问题是它是否明显超过42%。 如果我们采用其他简单随机样本,则当前观察到的人口比例(46%)可能会有所不同。
To find out if the observed population proportion is significantly more than the null hypothesis, perform a hypothesis test.
要确定观察到的总体比例是否明显大于零假设,请执行假设检验。
Step 3: Calculate the Test Statistic:
步骤3:计算测试统计量:
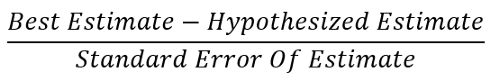
Here is the formula for test-statistics:
这是检验统计量的公式:

We use this formula for standard error:
我们使用以下公式计算标准误差:
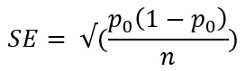
In this formula, p0 is 0.42 (according to the null hypothesis) and n is the size of the sample population. Now calculate the Standard error and the test statistics:
在此公式中,p0为0.42(根据原假设),n为样本总体的大小。 现在计算标准误差和测试统计数据:
se = np.sqrt(0.42 * (1-0.42) / len(df))Find the test statistics using the formula for test statistic above:
使用上面的测试统计量公式查找测试统计量:
#Best estimate
be = p_us  #hypothesized estimate
he = 0.42test_stat = (be - he)/se
The test statistics came out to be 1.3665.
测试统计结果为1.3665。
Step 4: Calculate the p-value
步骤4:计算p值
This test statistic is also called z-score. You can find the p-value from a z_table or you can find the p-value from this formula in python.
此测试统计信息也称为z得分。 您可以从z_table中找到p值,也可以从python中的此公式中找到p值。
pvalue = 2*dist.norm.cdf(-np.abs(test_stat))The p-value is 0.1718. It means the sample population proportion (46% or 0.46) is 0.1718 null standard errors above the null hypothesis.
p值为0.1718。 这意味着样本人口比例(46%或0.46)为高于零假设的0.1718零标准误差。
Step 5: Infer the conclusion from the p-value
步骤5:从p值推断结论
Consider the significance level alpha to be 5% or 0.05. A significance level of 5% or less means that there is a probability of 95% or greater that the results are not random.
考虑显着性水平alpha为5%或0.05。 显着性水平为5%或更低意味着有95%或更高的概率表明结果不是随机的。
Here p-value is bigger than our considered significance level 0.05. So, we cannot reject the null hypothesis. That means there is no significant difference in population proportion having heart disease in Ireland and the US.
在这里,p值大于我们考虑的显着性水平0.05。 因此,我们不能拒绝原假设。 这意味着在爱尔兰和美国,患有心脏病的人口比例没有显着差异。
对两个比例的差异进行假设检验 (Hypothesis Tests for the Difference in Two Proportions)
Comparative tests are conducted much more frequently than one population proportion hypothesis test. A two-sample test of proportions is performed to assess if the population proportion of some traits differs between two subgroups.
比较测试比一个人口比例假设测试要频繁得多。 进行了两个样本的比例测试,以评估两个子组之间某些性状的种群比例是否不同。
Here, we are going to test if the population proportion of females with heart disease is different from the population proportion of males with heart disease.
在这里,我们将测试患有心脏病的女性人口比例与患有心脏病的男性人口比例是否不同。
Step 1: Set up the null hypothesis, alternative hypothesis, and significance level.
步骤1:设置原假设,替代假设和显着性水平。
Here, we want to check if there is any difference between the population proportion of males and females having heart disease. We will start with the assumption that there is no difference.
在这里,我们要检查患有心脏病的男性和女性的人口比例之间是否存在差异。 我们将从没有差异的假设开始。
Ho: p1 -p2 = 0This is our null hypothesis. Here, p1 is the population proportion of females with heart disease and p2 is the population proportion of males having heart disease.
这是我们的原假设。 在此,p1是患有心脏病的女性的人口比例,p2是患有心脏病的男性的人口比例。
What could be the alternative hypothesis?
替代假设可能是什么?
The alternative hypothesis can be, there is a difference.
替代假设可能存在差异。
Ha: p1 - p2 != 0Let’s use the significance level of 0.1 or 10%.
让我们使用0.1或10%的显着性水平。
Step 2: Prepare a chart that shows the population proportion of males and females with heart disease and the total male and female population.
步骤2:准备一个图表,显示患有心脏病的男性和女性的人口比例以及男性和女性的总人口。
df['Gender'] = df.Sex.replace({1: "Male", 0: "Female"})
p = df.groupby("Gender")['AHD'].agg([lambda z: np.mean(z=='Yes'), "size"])
p.columns = ["HeartDisease", 'Total']
p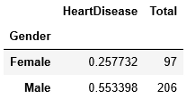
Step 3: Calculate the test statistic
步骤3:计算测试统计量
We will use the same formula for the test statistic as before. The best estimate is p1 — p2. Here, p1 is the population proportion of females with heart disease and p2 is the population proportion of males with heart disease.
我们将使用与以前相同的公式来进行测试统计。 最佳估计是p1-p2。 在此,p1是患有心脏病的女性的人口比例,p2是患有心脏病的男性的人口比例。
#Best estimate is p1 - p2. Get p1 and p2 from the chart p above
p_fe = p.HeartDisease.Female
p_male = p.HeartDisease.Male
The standard error for two population proportion is calculated with the formula below:
使用以下公式计算两个人口比例的标准误差:
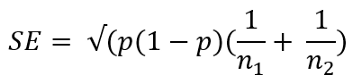
Here, p is the total population proportion in the sample with heart disease. n1 and n2 are the total numbers of the female and male populations in the sample.
在此,p是心脏病样本中总人口比例。 n1和n2是样本中女性和男性人口的总数。
p = p_us  #calculated in the beginning of the previous example
n1 = p.Total.Female
n2 = p.Total.Male
se = np.sqrt(p_us*(1-p_us)*(1/n1 + 1/n2))
Now, use this standard error and calculate the test statistic.
现在,使用此标准错误并计算测试统计量。
#calculate the best estimate
be = p_fe - p_male  #Calculate the hypothesized estimate
#Our null hypothesis is p1 - p2 = 0he = 0  #Calculate the test statistic
test_statistic = (be - he)/se
The calculated test_statistic is -0.296. That means that the observed difference in sample proportions is 0.296 estimated standard error below the hypothesized value.
计算得出的test_statistic为-0.296。 这意味着观察到的样品比例差异是低于假设值的0.296估计标准误差。
Step 4: Calculate the p-value
步骤4:计算p值
pvalue = 2*dist.norm.cdf(-np.abs(test_statistic)The p-value is 0.7675. That means more than 76% of the time we would see that the results we observed are true considering the null hypothesis is true.
p值为0.7675。 这意味着,在原假设为真的情况下,超过76%的时间我们会看到观察到的结果为真。
In another way, the p-value is bigger than the significance level (0.1). So, we do not have enough evidence to reject the null hypothesis.
换句话说,p值大于显着性水平(0.1)。 因此,我们没有足够的证据来拒绝原假设。
The population proportion of males with heart disease is not significantly different than the population proportion of females with heart disease.
患有心脏病的男性人口比例与患有心脏病的女性人口比例没有显着差异。
假设检验一均值 (Hypothesis Testing for One Mean)
This is a simple hypothesis testing process. We can perform this test if we have a specific fixed mean value to compare. Let’s work on an example to understand the process.
这是一个简单的假设检验过程。 如果我们要比较特定的固定平均值,则可以执行此测试。 让我们以一个例子来理解这个过程。
This is the research question:
这是研究问题:
“Check if the mean RestBP is great than 135”. Here, RestBP is resting blood pressure. We have a RestBP column in the DataFrame. Let’s solve this problem step by step.
“检查平均RestBP是否大于135”。 在这里,RestBP是静态血压。 我们在DataFrame中有一个RestBP列。 让我们逐步解决此问题。
Step 1: State the hypothesis
步骤1:陈述假设
We need to find out if the mean RestBP is greater than 135. Let’s assume that the mean RestBP is less than or equal to 135.
我们需要找出平均RestBP是否大于135。让我们假设平均RestBP小于或等于135。
So, the null hypothesis can be that mean RestBP is 135. Because if we can prove that the mean RestBP is greater than 135, it is automatically greater than 134 or 130.
因此,零假设可以是平均RestBP为135。因为如果我们可以证明平均RestBP大于135,则它自动大于134或130。
If we find enough evidence to reject the null hypothesis, we can accept that the mean RestBP is greater than 135. This is the alternative hypothesis for this example.
如果我们找到足够的证据来拒绝原假设,那么我们可以接受平均RestBP大于135的结论。这是该示例的替代假设。
Ho: mu = 135
Ha: mu > 135
We will check if we can reject the null hypothesis using a significance level of 0.05.
我们将检查是否可以使用显着性水平0.05否定原假设。
Step 2: Check the assumptions
步骤2:检查假设
There are two assumptions:
有两个假设:
- The sample should be a simple random sample. 样本应该是简单的随机样本。
- The data need to be normally distributed. 数据需要正态分布。
I collected this dataset from Kaggle. I was not involved in collecting the data. For the demonstration purpose, just assume that this is a simple random sample. To check the second assumption, plot the data, and have a look at the distribution.
我从Kaggle收集了这个数据集。 我没有参与收集数据。 出于演示目的,仅假设这是一个简单的随机样本。 要检查第二个假设,请绘制数据并查看分布。
sns.distplot(df.RestBP)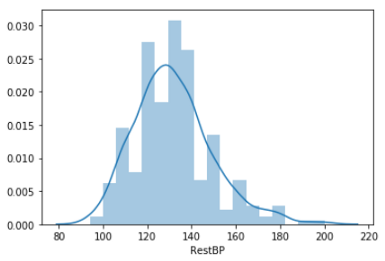
The distribution is not exactly normal. But it is close to normal.
分布不完全正常。 但这已经接近正常。
The good news is, we do not need to worry about the normality of the data. Because we have a large enough sample size(more than 25 data).
好消息是,我们无需担心数据的正常性。 因为我们有足够大的样本量(超过25个数据)。
Step 3: Calculate the test statistic
步骤3:计算测试统计量
Here is the formula to calculate the test statistic:
这是计算测试统计量的公式:
First, calculate the standard error using the formula below:
首先,使用以下公式计算标准误差:
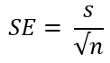
Here, S is the sample standard deviation and n is the number of samples.
在此,S为样品标准偏差,n为样品数。
std= df.RestBP.std()
n = len(df)
se = std/np.sqrt(n)
Now, use this standard error to find the test statistic:
现在,使用此标准错误查找测试统计信息:
#Best estimate
be = df.RestBP.mean() #Hypothesized estimatehe = 135
test_statistic = (be - he)/se
Test statistic came out to be -3.27. Look at the formula for test statistics. On top, it measures the distance between the original mean and hypothesized mean. And the bottom is the standard error.
测试统计结果为-3.27。 查看公式以获取测试统计信息。 最重要的是,它测量原始均值和假设均值之间的距离。 底部是标准误差。
So, this test_statistic means, the sample mean is 3.27 standard error below the hypothesized mean.
因此,该test_statistic表示,样本均值比假设均值低3.27标准误。
Step 4: Infer the conclusion from the test statistic
步骤4:根据测试统计量推断结论
Convert this test_statistic to a probability value to see if this difference is unusual or not. We can get the value using this python formula:
将此test_statistic转换为概率值,以查看此差异是否异常。 我们可以使用以下python公式获取值:
pvalue = 2*dist.norm.cdf(-np.abs(test_statistic))The p-value is 0.001 which is less than the significance level (0.05).
p值为0.001,小于显着性水平(0.05)。
So, we can reject the null hypothesis.
因此,我们可以拒绝原假设。
There is only a 0.1% probability that we will see the observed result is true when the null hypothesis is true. 0.1% probability is too low.
当原假设为真时,只有0.1%的概率可以看到观察到的结果为真。 0.1%的概率太低。
So, we reject the null hypothesis and accept the alternative hypothesis based on this sample data.
因此,我们拒绝原假设,并根据此样本数据接受替代假设。
均值差异的假设检验 (Hypothesis Testing for the Difference in Mean)
For this example, we will use the same data, the RestBP column. But this time to test if there is any difference between the mean RestBP of females to the mean RestBP of males.
在此示例中,我们将使用相同的数据RestBP列。 但这一次测试女性的平均RestBP与男性的平均RestBP之间是否存在差异。
Step 1: State the hypothesis
步骤1:陈述假设
As a null hypothesis, start with the claim that the mean RestBP of females and the mean RestBP of males are the same. So the difference between these two means will be zero.
作为无效假设,请从这样的说法开始,即女性的平均RestBP和男性的平均RestBP相同。 因此,这两个均值之差将为零。
The alternative hypothesis is, these two means are not the same. Let’s perform the test with a 10% significance level.
另一个假设是,这两种方法不相同。 让我们以10%的显着性水平执行测试。
Ho: mu_female - mu_male = 0
Ha: mu_female - mu_male != 0
Both the male and female populations have large enough data in this data. So, checking for the normality of the data is not required.
男性和女性人口都具有足够大的数据。 因此,不需要检查数据的正常性。
Step 2: Calculate the test statistic
步骤2:计算测试统计量
The formula for the test statistic is the same as before. But the formula for the standard error is different.
测试统计信息的公式与以前相同。 但是标准误差的公式不同。
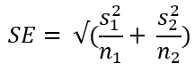
Here s1 and s2 are the sample standard deviation of the female and male population respectively. n1 and n2 are the sample size of the female and male population. Now, calculate the standard error:
这里s1和s2分别是女性和男性人口的样本标准差。 n1和n2是男性和女性人口的样本量。 现在,计算标准误差:
pop_fe = df[df.Gender=='Female'].dropna()
pop_male = df[df.Gender=='Male'].dropna()std_fe = pop_fe.RestBP.std()
std_male = pop_male.RestBP.std()se = np.sqrt(std_fe**2/len(pop_fe) + std_male**2/len(pop_male))
Use the standard error to get the test statistic.
使用标准错误获取测试统计信息。
#calculate the best estimate
mu_fe = pop_fe.RestBP.mean()     #Mean RestBP for females
mu_male = pop_male.RestBP.mean()  #Mean RestBP for malesmu_diff = mu_fe - mu_male    #hypothesized estimate
mu_diff_hyp = 0   #null hypothesis: difference of two mean = zerotest_statistic = (be-he)/se
The test_statistic is 1.086. For the information, the observed difference in mean ‘mu_diff’ is 2.52.
test_statistic为1.086。 对于此信息,观察到的平均值“ mu_diff”之差为2.52。
As we are testing if the mean is different from each other, this is a two-tailed test.
当我们测试均值是否彼此不同时,这是一个两尾检验。
The p-value is the probability that the test statistic is either less than 1.086 or greater than 1.086.
p值是检验统计量小于1.086或大于1.086的概率。
Step 3: Infer the conclusions from the test statistic
步骤3:根据测试统计量推断结论
Calculate the p-value from this test statistic in python:
从python中的此测试统计信息计算p值:
pvalue = 2*dist.norm.cdf(-np.abs(test_statistic))The p-values came out to be 0.277. As this is a two-tailed test,
p值得出的值为0.277。 由于这是两尾测试,
p(z < -1.086) = 0.277
p(z <-1.086)= 0.277
p(z > 1.086) = 0.277
p(z> 1.086)= 0.277
p-value = 0.277+0.277 = 0.554
p值= 0.277 + 0.277 = 0.554
That means, there is approximately 55.4% probability that the observed result or more extreme is true when the null hypothesis is true.
这就是说,当零假设为真时,观察到的结果或更多极端为真的概率约为55.4%。
In another way, the p-value is much bigger than the significance level. So, we fail to reject the null hypothesis.
换句话说, p值比显着性水平大得多。 因此,我们无法拒绝原假设。
The final inference is, based on the observed difference between the mean RestBP of females and the mean RestBP of males, we cannot support the idea that there is a significant difference between the two means.
最终的推断是,基于观察到的女性平均RestBP与男性平均RestBP之间的差异,我们不能支持两种方法之间存在显着差异的观点。
结论 (Conclusion)
I explained the four most common types of research questions in this article with working examples. This should provide enough knowledge to start using hypotheses in your decision making.
我通过工作示例解释了本文中四种最常见的研究问题类型。 这应该提供足够的知识,以便在您的决策中开始使用假设。
推荐读物 (Recommended Reading)
翻译自: https://towardsdatascience.com/a-complete-guide-to-hypothesis-testing-in-python-6c34c855af5c
假设检验python


 393
393


 被折叠的 条评论
为什么被折叠?
被折叠的 条评论
为什么被折叠?
 到【灌水乐园】发言


