


 本文介绍了如何使用Zabbix来监控Kafka系统,确保其稳定运行。内容来源于一篇翻译自Devoops and Universe的文章,提供了关于配置Zabbix监控Kafka的详细步骤。
zabbix监控kafka
介绍 (Introduction)
Apache Kafka is modern, powerful and fancy service provides storing and managing messages for real-time data processing.
Apache Kafka是一种现代,功能强大且新颖的服务,可提供存储和管理消息以进行实时数据处理。
Unfortunately, Apache Kafka has no monitoring tools by default but sometimes when Kafka has issues we should define and fix issues asap to prevent interruptions, loosing data and make sure that our services work properly.
不幸的是,Apache Kafka默认情况下没有监视工具,但是有时在Kafka出现问题时,我们应该尽快定义和修复问题,以防止中断,丢失数据并确保我们的服务正常运行。
Topic explains the easiest way how to monitoring Kafka using official Zabbix open-source monitoring system plugin that includes collecting JMX metric, alerting and monitoring consumers as well.
主题介绍了如何使用官方的Zabbix开源监视系统插件监视Kafka的最简单方法,该插件包括收集JMX指标,警告和监视使用者。
卡夫卡概述 (Kafka overview)
Publish-subscribe durable messaging system
发布-订阅持久消息系统
A messaging system sends messages between processes, applications, and servers. Apache Kafka is a software where topics can be defined (think of a topic as a category), applications can add, process and reprocess records.
消息传递系统在进程,应用程序和服务器之间发送消息。 Apache Kafka是一种软件,可以在其中定义主题(将主题视为类别),应用程序可以添加,处理和重新处理记录。
Applications connect to this system and transfer a record onto the topic. A record can include any kind of information; for example, information about an event that has happened on a website, or an event that is supposed to trigger an event. Another application may connect to the system and process or re-process records from a topic. The data sent is stored until a specified retention period has passed by.
应用程序连接到该系统并将记录转移到该主题上。 记录可以包含任何种类的信息; 例如,有关网站上发生的事件或应该触发事件的事件的信息。 另一个应用程序可以连接到系统并处理或重新处理主题中的记录。 发送的数据将被存储,直到经过了指定的保留期限。
Main parts in a Kafka system
Kafka系统的主要部件
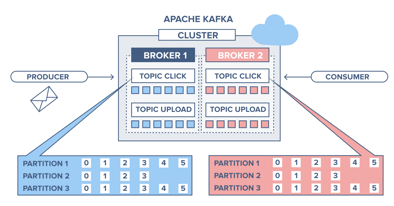
Broker: Handles all requests from clients (produce, consume, and metadata) and keeps data replicated within the cluster. There can be one or more brokers in a cluster.
代理:处理来自客户端的所有请求(生产,使用和元数据),并将数据复制到集群中。 集群中可以有一个或多个代理。
Zookeeper: Keeps the state of the cluster (brokers, topics, users).
Zookeeper:保持群集的状态(经纪人,主题,用户)。
Producer: Sends records to a broker.
生产者:将记录发送给经纪人。
Consumer: Consumes batches of records from the broker.
使用者:从经纪人那里消费一批记录。
Zabbix概述 (Zabbix overview)
Zabbix is an open-source monitoring software tool for diverse IT components, including networks, servers, virtual machines (VMs) and cloud services.
Zabbix是用于各种IT组件(包括网络,服务器,虚拟机(VM)和云服务)的开源监视软件工具。
 最低0.47元/天 解锁文章


 1144
1144


 被折叠的 条评论
为什么被折叠?
被折叠的 条评论
为什么被折叠?
 到【灌水乐园】发言


