


 本文深入介绍了EDA(Exploratory Data Analysis),这是一种利用统计和可视化技术理解数据特性的方法。通过EDA,数据科学家可以发现模式、趋势和异常,为后续的建模和决策提供依据。文章详细探讨了EDA的重要性,并提供了实践指导。
eda分析
Most data analysis problems start with understanding the data. It is the most crucial and complicated step. This step also affects the further decisions that we make in a predictive modeling problem, one of which is what algorithm we are going to choose for a problem.
中号 OST的数据分析问题开始理解数据。 这是最关键和最复杂的步骤。 此步骤还会影响我们在预测建模问题中做出的进一步决策,其中一项是我们要为问题选择的算法。
In this article, we will see a complete tough guide for such a problem.
在本文中,我们将看到有关此问题的完整指南。
Content
内容
- Reading Data 读取数据
- Variable Identification 变量识别
- Univariate analysis 单变量分析
- Bivariate analysis 双变量分析
- Missing values- types and analysis 缺失值-类型和分析
- Outlier treatment 离群值处理
- Variable Transformation 变量变换
读取数据和变量识别 (Reading data and Variable Identification)
Reading the data infers getting the answers to the following questions
读取数据可以得出以下问题的答案
- What is the shape of my data? 数据的形状如何?
- How many features does my data contain? 我的数据包含多少个功能?
- What does it look like? 它是什么样子的?
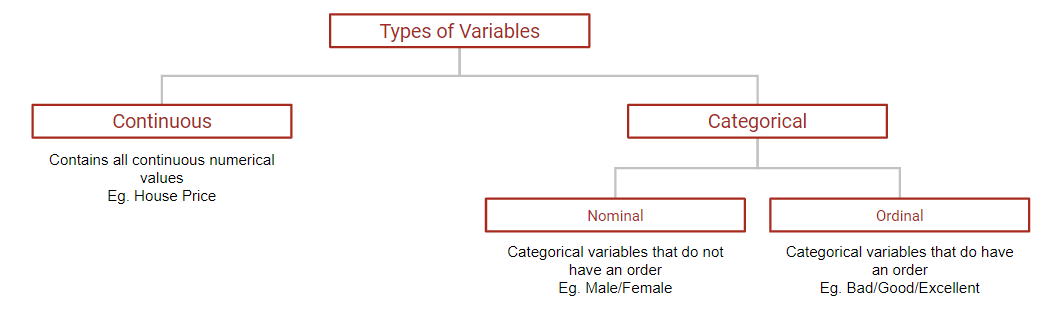
- What are the types of variables? 变量的类型是什么?
单变量分析(UA) (Univariate Analysis (UA))
什么是UA? (What is UA?)
When we explore a single variable at a time from a given list of features, its called UA. We summarize the variable and help us better understand the data.
当我们一次从给定的功能列表中探索单个变量时,其称为UA。 我们总结了变量并帮助我们更好地理解了数据。
We see for the following things in UA
我们在UA中看到以下内容
- Central tendency (mean, median, mode) and dispersion of the variable 变量的集中趋势(均值,中位数,众数)和离散
- Distribution of variable- symmetric, right-skewed or left-skewed 对称分布,右偏或左偏的分布
- Missing values and outliers 缺失值和离群值
- Count and count percent: Observing the frequency of each category in a categorical variable helps us to understand and deal with that variable. 计算百分比:观察类别变量中每个类别的频率有助于我们理解和处理该变量。
为什么选择UA? (Why UA?)
We explore that variable, checks for anomalies like outliers, and missing values that we will see in the latter part.
我们将探索该变量,检查异常值(如异常值)和缺失值,我们将在后面的部分中看到这些值。
UA方法 (Methods for UA)
For Continuous Variables:
对于连续变量:
- Tabular Method: Used to describe central tendencies, dispersion, and missing values. 表格方法:用于描述中心趋势,离散度和缺失值。
Graphical Method: Used for distribution and checking Outliers. We can use Histograms for understanding distribution and Box Plots for outliers detection.
图形方法:用于分发和检查离群值。 我们可以使用直方图来了解分布,而可以使用箱形图来检测异常值。
A combination of Histograms and Box plots is called a Violin Plot
直方图和箱形图的组合称为小提琴图

For Categorical variables:
对于分类变量:
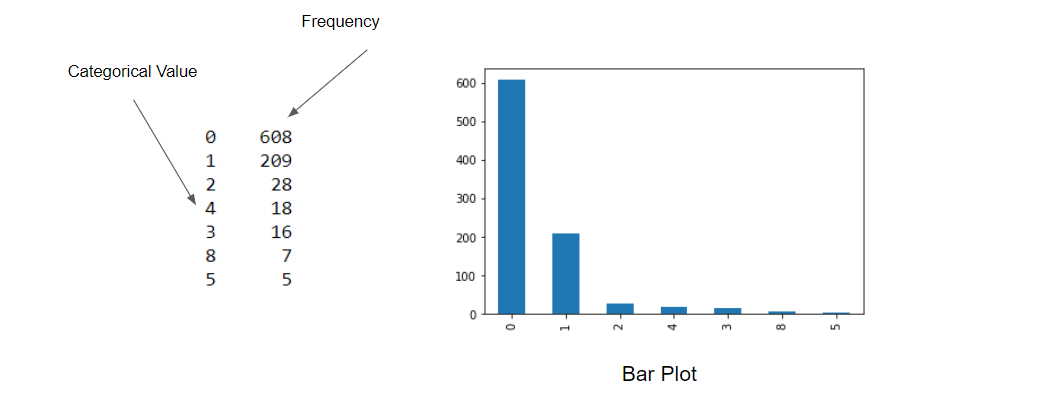
- Tabular Method: “.value_counts()” operation in python gives a tabular form of frequencies. 表格方法:python中的“ .value_counts()”操作提供了表格形式的频率。
- Graphical Method: The best graph that is used in the case of a categorical variable is barplot. 图形方法:对于分类变量,使用的最佳图形是条形图。
双变量分析(BA) (Bivariate Analysis (BA))
什么是学士学位? (What is BA?)
When we study the empirical relationship of two variables concerning each other, it is called BA.
当我们研究两个变量彼此相关的经验关系时,称为BA。
为什么要学士学位? (Why BA?)
It helps to detect anomalies, understand the dependence of two variables on each other, and the impact of each variable ion the target variable.
它有助于检测异常,了解两个变量之间的依赖性,以及每个变量对目标变量的影响。
BA的方法 (Methods for BA)
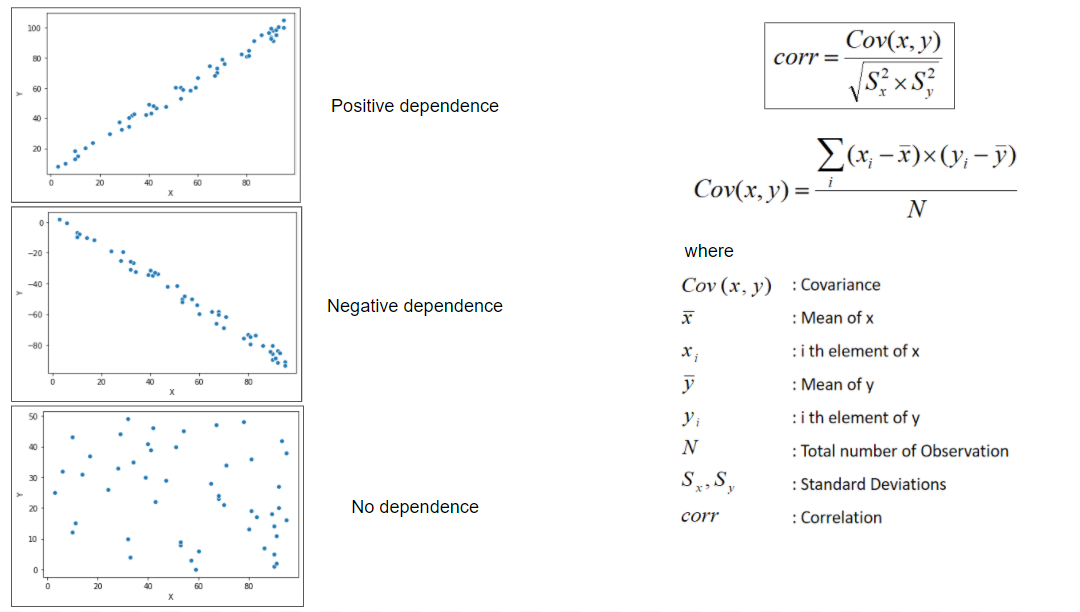
For Continuous-Continuous types: There are two methods to study the relationship between two continuous variables i.e. A scatter plot and the correlation analysis.
对于连续-连续类型 :有两种方法研究两个连续变量之间的关系,即散点图和相关性分析 。
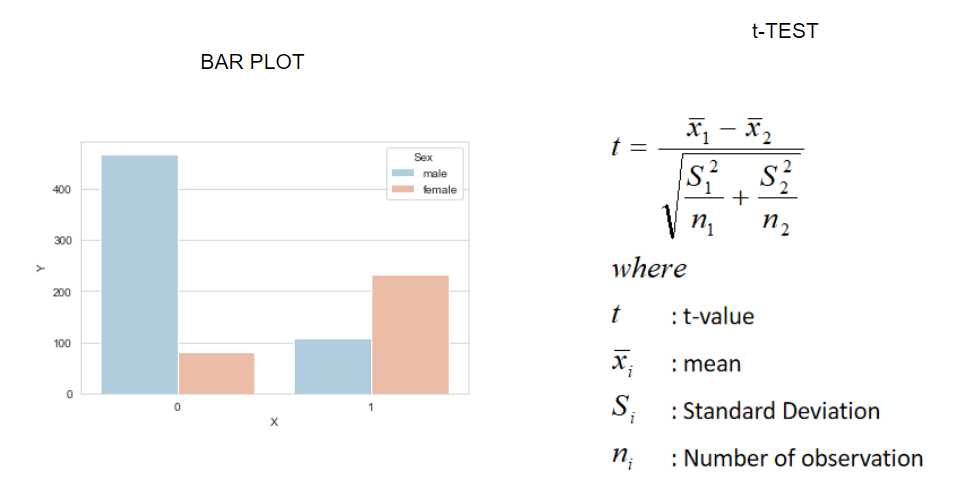
2. For categorical-continuous types: Under this head, we can use bar plots and T-tests for the analysis purpose.
2. 对于连续类别:在此标题下,我们可以使用条形图和T检验进行分析。
The T-test is a type of inferential statistic used to determine if there is a significant difference between the means of two or more groups/categories. Calculating a t-test requires the difference between the mean values and the standard deviation from each category.
T检验是一种推论统计量,用于确定两个或多个组/类别的均值之间是否存在显着差异。 计算t检验需要每个类别的平均值和标准偏差之间的差。
3. For Categorical-categorical types: Two-way table and Chi-square test are used to analyze the relationship of two categorical variables.
3. 对于分类类别类型:使用双向表和卡方检验分析两个分类变量之间的关系。
缺失值 (Missing Values)
缺少价值的原因? (Reasons for Missing Values?)
There can be various missing values in data, some of which can be
数据中可能存在各种缺失值,其中一些可能是
- There may not be may response recorded. 可能没有记录响应。
- There can be some error while recording the data 记录数据时可能会出现一些错误
- There can be some error while reading the data, etc. 读取数据时可能会出错,等等。
缺失值的类型? (Types of Missing values?)
Missing Completely at Random (MCAR): These are the missing values that do not have any relation with any other variable or the variable in which they are occurring.
完全随机缺失(MCAR):这些缺失值与任何其他变量或发生它们的变量没有任何关系。
Missing at random (MAR): The missing values that do not have any relation within the variable they exist but may have an observable trend in other variables. Eg. The income data for people having age greater than 60 years can be missing as people with that age are generally retired.
随机缺失(MAR):这些缺失值在存在的变量中没有任何关系,但在其他变量中可能有可观察的趋势。 例如 。 年龄超过60岁的人的收入数据可能会丢失,因为该年龄的人通常已经退休。
Missing Not at Random (MNAR): The missing value has a relation in the variable they exist. Eg. House having a price more than Rs. 2 crores can be missing in the database as for that price there cannot be frequent buyers.
随机缺失(MNAR):缺失值与它们存在的变量有关。 例如 。 价格超过Rs的房子。 数据库中可能缺少2千万,因为该价格不能频繁购买。
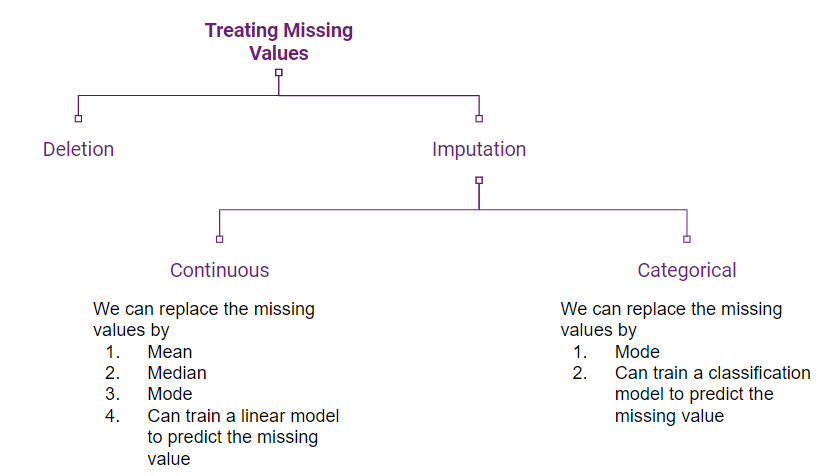
缺失值的处理方法 (Methods of dealing Missing Values)
There are two basic methods to deal with missing values
有两种处理缺失值的基本方法
Deletion: We delete all the missing value rows from the dataset before training the model.
删除:我们在训练模型之前从数据集中删除所有缺失值行。
Imputation: There are various methods by which we can fill the missing values.
归因:我们可以通过多种方法来填充缺失值。
离群值 (Outliers)
离群值的类型及其识别 (Types of Outliers and their identification)
There are two types of outliers:
有两种异常值:
Univariate Outlier: It can be identified using a box plot.
单变量离群值:可以使用箱形图进行识别。
Bivariate Outliers: It can be identified using a scatter plot between the two variables.
双变量离群值:可以使用两个变量之间的散点图来识别。
离群值的标准 (Criteria for an outlier)
Criteria for X to be outlier:Q1: median for first 25% observation when sorted in ascending order
Q2: median for last 25% observation when sorted in ascending order
Q3: median of all observationIQR: Inter quartile range = Q3-Q1
if X is outlier then X must satisfy:X > (Q3 + 1.5*IQR) OR X < (Q1-1.5*IQR)
异常值的处理 (Treatment of outlier)
- We can delete that observation. 我们可以删除该观察。
- We can impute the value of outlier by the methods discussed in ways for imputing missing values. 我们可以通过以估算缺失值的方式讨论的方法来估算离群值。
- We can apply transformations (to be discussed next) 我们可以应用转换(将在下面讨论)
变量变换 (Variable Transformation)
We all know that normalization increases the accuracy of the model. But what exactly is normalization? It is one of the techniques of variable transformation.
众所周知,归一化可以提高模型的准确性。 但是规范化到底是什么? 它是变量转换的技术之一。
In variable transformation, we replace the variable by one of its functions. for example, replace the variable x by its log value.
在变量转换中,我们用变量的功能之一代替变量。 例如,将变量x替换为其对数值。
We can try to fix the following things that we have obtained as an observation in previous EDA processes:
我们可以尝试修复在以前的EDA过程中观察得到的以下问题:
- We can change the scale of the variable (redefining the limits of a variable) 我们可以更改变量的小数位数(重新定义变量的限制)
- Conversion of a non-linear relationship into a linear relationship 将非线性关系转换为线性关系
- It is observed that algorithms better perform on symmetrically distributed variables than skewed so we can convert skewed distribution to symmetric distribution. 可以看出,算法在对称分布变量上的性能要优于偏态分布,因此我们可以将偏态分布转换为对称分布。
变量转换方法 (Methods of Variable Transformation)
Non-linear transformation: We can replace the variable by its log value, square root, or cube root. These are non-linear transformations, hence help us to deal with all the points stated above.
非线性转换 :我们可以用变量的对数值,平方根或立方根替换变量。 这些是非线性变换,因此有助于我们处理上述所有问题。
Binning: We can divide the continuous values into various bins hence converting a continuous variable into categorical. This may help us to categorize the outlier into some categories with which our model can deal.
Binning:我们可以将连续值划分为不同的bin,从而将连续变量转换为分类变量。 这可以帮助我们将异常值分类为模型可以处理的某些类别。
加起来 (Summing up)
This is an extensive guide for Exploratory Data Analysis. This not only includes how to detect anomalies but also how to deal and get rid of them. This is a very naive approach to EDA hence most of the chapters are covered yet.
这是探索性数据分析的详尽指南。 这不仅包括如何检测异常,还包括如何处理和消除异常。 这是一种非常幼稚的EDA方法,因此大多数章节都已介绍。
翻译自: https://towardsdatascience.com/the-eda-theoretical-guide-b7cef7653f0d
eda分析


 被折叠的 条评论
为什么被折叠?
被折叠的 条评论
为什么被折叠?
 到【灌水乐园】发言


