


python创建类统计属性
介绍 (Introduction)
Sometimes you may need a distribution figure for your slide or class. Since you are not using data, you want a quick solution.
有时,您的幻灯片或课程可能需要一个分配图。 由于您不使用数据,因此需要快速解决方案。
A Python package, Statsfig, can create different distribution figures with one line of code.
Python套件Statsfig可以用一行代码创建不同的分布图。
I’d like to show you how easy it is to create each figure.
我想向您展示创建每个图形有多么容易。
安装 (Installation)
Using pip :
使用pip :
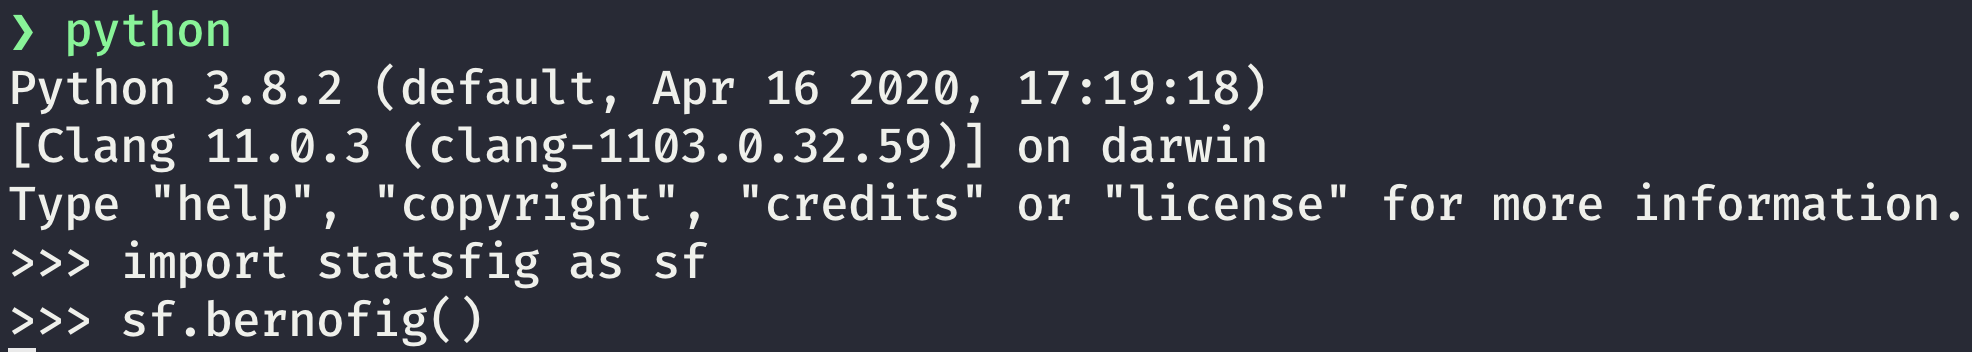
pip install statsfigThen import it.
然后导入。
import statsfig as sf功能清单 (List of Functions)
There are eleven functions you can use. Ten distribution functions and one plot.
您可以使用十一个功能。 十个分布函数和一个图。
伯努利分布 (Bernoulli distribution)
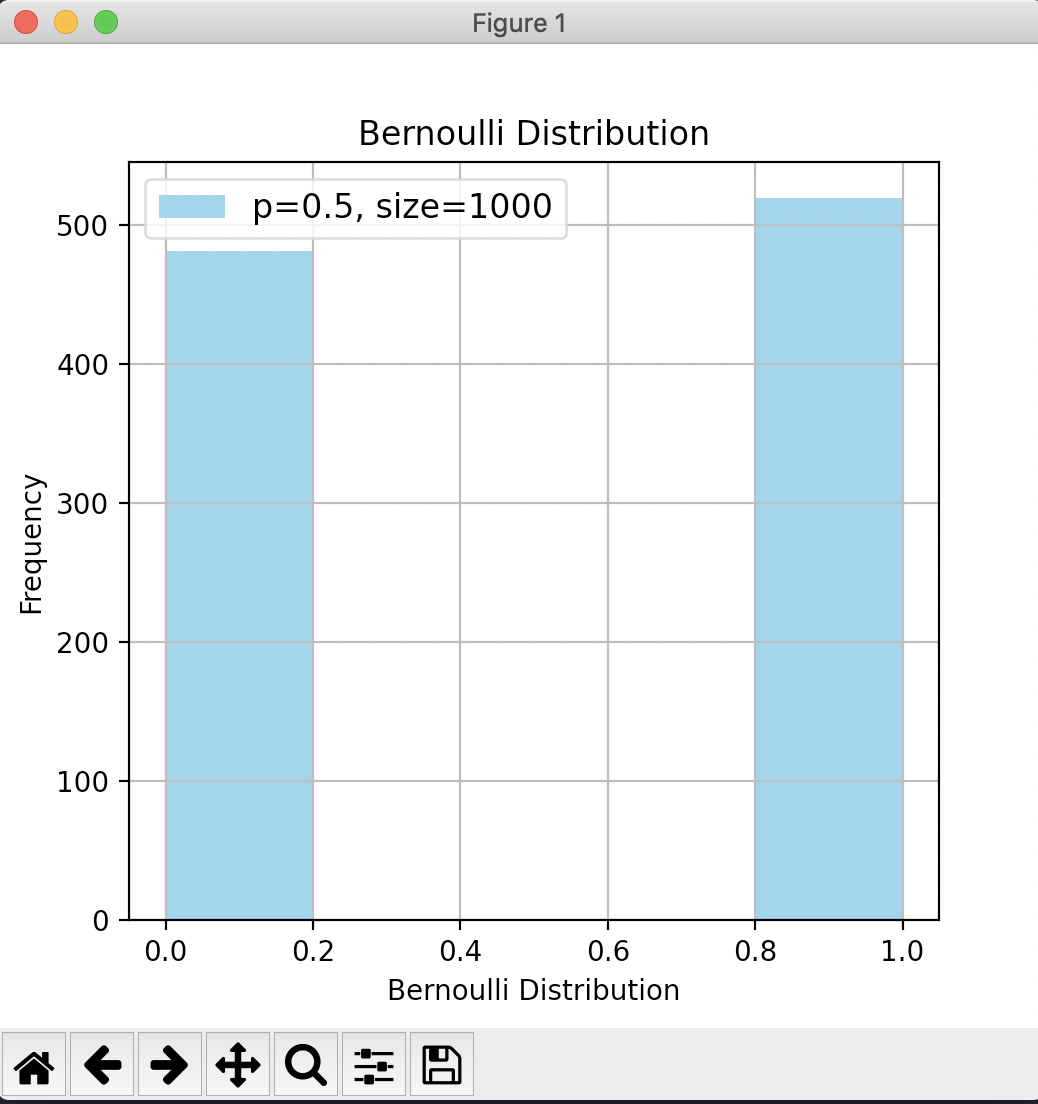
bernofig() (bernofig())
The bernofig() function creates a Bernoulli distribution and the following table shows all the parameters.
bernofig()函数创建一个Bernoulli分布,下表显示了所有参数。
The default function has a probability of 0.5 and a size of 1000.
默认函数的概率为0.5,大小为1000。
The following example shows a probability of 0.6, a different color, and without the grid.
以下示例显示了0.6的概率,不同的颜色并且没有网格。
二项分布 (Binomial Distribution)
binofig() (binofig())
The binofig() function creates a binomial distribution and the following table shows all the parameters.
binofig()函数创建一个二项式分布,下表显示了所有参数。
The default function has a probability of 0.5 and a size of 1000.
默认函数的概率为0.5,大小为1000。
The following example has a probability of 0.7, the number is trials of 30 and shifting 1 to the right.
下面的示例的概率为0.7,次数为30,向右移动1。
箱须图 (Box and Whisker Plot)
This is the only one that is not a distribution figure.
这是唯一一个没有分配数字的人。
箱形图() (boxplot())
The boxplot() function creates a box and whisker plot and the following table shows all the parameters.
boxplot()函数创建一个箱须图,下表显示了所有参数。
The default function has the following value for the info argument.
默认函数的info参数具有以下值。
{‘bplot 1’:[-9, -4, 2, 4, 9], ‘bplot 2’:[-5, -2, 1, 3, 8], ‘bplot 3’:[1, 4, 6, 8, 10]}The info must have a dictionary form with name:[min, lower quartile, median, upper quartile, max].
info必须具有name:[min, lower quartile, median, upper quartile, max]的字典形式。
If you want to show only one box and whisker plot, you can do this:
如果您只想显示一个方框图和晶须图,则可以执行以下操作:
Changing vert=False displays the plot horizontally.
更改vert=False会水平显示绘图。
卡方分布 (Chi-square Distribution)
chifig() (chifig())
The chifig() function creates a Chi-square distribution and the following table shows all the parameters.
chifig()函数创建一个卡方分布,下表显示了所有参数。
The default function has [1,4,6,7] for the degree of freedom.
默认功能的自由度为[1,4,6,7]。
You can change the degrees of freedom by changing the dof argument using a python list as following.
您可以使用以下python列表通过更改dof参数来更改dof 。
指数分布 (Exponential Distribution)
expofig() (expofig())
The expofig() function creates an Exponential distribution and the following table shows all the parameters.
expofig()函数创建指数分布,下表显示了所有参数。
The default function has a standard deviation of 1 and size of 1000.
默认功能的标准偏差为1,大小为1000。
You can hide the histogram by changing the hist argument to False.
您可以通过将hist参数更改为False来隐藏直方图。
伽玛分布 (Gamma Distribution)
gammafig() (gammafig())
The gammafig() function creates a Gamma distribution and the following table shows all the parameters.
gammafig()函数创建一个Gamma分布,下表显示了所有参数。
The default function has a shape parameter of 5 and a size of 1000.
默认函数的shape参数为5,大小为1000。
You can change the color by changing the color argument. You can use one of the characters {'b', 'g', 'r', 'c', 'm', 'y', 'k', 'w'}, which are short-hands for blue, green, red, cyan, magenta, yellow, black, and white. You can also use a hex RGB or RGBA string (e.g., '#4287f5' or '#4287f580').
您可以通过更改color参数来更改color 。 您可以使用以下字符之一: {'b', 'g', 'r', 'c', 'm', 'y', 'k', 'w'} ,它们是蓝色,绿色的简写形式,红色,青色,洋红色,黄色,黑色和白色。 您也可以使用十六进制RGB或RGBA字符串(例如'#4287f5'或'#4287f580' )。
正态分布 (Normal Distribution)
规范 (normcdf)
The normcdf() function creates a Normal distribution and the following table shows all the parameters.
normcdf()函数创建一个正态分布,下表显示了所有参数。
The default function has a mean of 0 and a standard deviation of 1.
默认函数的平均值为0,标准偏差为1。
If you wish, you can change most of the arguments as follows:
如果愿意,可以如下更改大多数参数:
Changing the lb, the lower quartile and the ub, the upper quartile, you can find the probability of between two values.
更改lb (下四分位数)和ub (上四分位数),您可以找到两个值之间的概率。
规范pdf_std (normpdf_std)
The normpdf_std() function creates a Normal distribution with different standard deviations. The following table shows all the parameters.
normpdf_std()函数创建具有不同标准偏差的正态分布。 下表显示了所有参数。
The default function has [1,2,3,4] for the degrees of freedom to display.
默认功能的显示自由度为[1,2,3,4]。
You can use a Python list to change the val argument for different degrees of freedom.
您可以使用Python列表更改不同自由度的val参数。
normpdf_mean (normpdf_mean)
The normpdf_mean() function creates a Normal distribution with different means. The following table shows all the parameters.
normpdf_mean()函数使用不同的方式创建正态分布。 下表显示了所有参数。
The default function has [0,1,2,3] for the mean values to display.
默认功能的平均值显示为[0,1,2,3]。
You can change the title, x-axis minimum, and maximum values as follows:
您可以如下更改标题,x轴最小值和最大值:
泊松分布 (Poisson Distribution)
poisfig() (poisfig())
The poisfig() function creates a Poisson distribution and the following table shows all the parameters.
poisfig()函数创建一个泊松分布,下表显示了所有参数。
The default function has 4 the μ value and a size of 1000.
默认函数的μ值为4,大小为1000。
均匀分布 (Uniform Distribution)
uniformfig() (uniformfig())
The uniformfig() function creates a Uniform distribution and the following table shows all the parameters.
uniformfig()函数创建一个Uniform分布,下表显示了所有参数。
The default function has a size of 1000, start at 10 and a width of 20.
默认功能的大小为1000,从10开始,宽度为20。
Here we are changing the color, grid, and figure width and length.
在这里,我们更改颜色,网格以及图形的宽度和长度。
终奌站 (Terminal)
You can create a figure from your terminal as well.
您也可以从终端创建图形。
结论 (Conclusion)
I hope you found it is much easier to create figures with the Statsfig package. I’d love to hear any comments about the package. Feel free to leave a message below, or reach out to me through Twitter.
我希望您发现使用Statsfig软件包创建图形要容易得多 。 我希望听到有关该包裹的任何评论。 随时在下面留言,或通过Twitter与我联系。
Please stay tuned for the next post.
请继续关注下一篇文章。
翻译自: https://towardsdatascience.com/a-python-package-to-create-stats-figures-with-ease-503cf6ec0b26
python创建类统计属性


 901
901

 被折叠的 条评论
为什么被折叠?
被折叠的 条评论
为什么被折叠?
 到【灌水乐园】发言


