material-ui
5 charts you can make right now without installing additional libraries.
您可以立即制作5张图表,而无需安装其他库。
I love using React with Material-UI to build my personal projects. The popular React UI library adheres to Google’s Material Design specification and comes with a plethora of highly customizable React components that make prototyping a breeze.
我喜欢将React与Material-UI一起使用来构建我的个人项目。 流行的React UI库遵循Google的Material Design规范,并带有大量高度可定制的React组件,这些组件使原型设计变得轻而易举。
However, as comprehensive as the component collection Material-UI offers, I still find myself looking up third-party libraries whenever I want to draw a simple chart. Do I use Recharts? Victory? Nivo? Or React Vis? Why do I have to add a third-party dependency for a basic donut chart in the first place?
但是,正如Material-UI提供的组件集合一样全面,无论何时我想绘制一个简单的图表,我仍然会查找第三方库。 我可以使用图表吗? 胜利了吗? 尼沃 ? 还是React Vis ? 为什么首先必须为基本的甜甜圈图添加第三方依赖性?
In this post, I will share my tips for building common charts by repurposing Material-UI prebuilt components.
在本文中,我将分享通过重新使用Material-UI预先构建的组件来构建通用图表的技巧。
基本组件 (Base Components)
The Box component is infinitely customizable, with enough CSS styling, you can craft the component into anything your heart desires. The Skeleton component can be manipulated into basic shapes with a quick set of properties. While it is possible to build our charts on top of either, my favorite components for building charts are LinearProgress and CircularProgress.
Box组件是无限可自定义的,具有足够CSS样式,您可以将组件制作成您内心渴望的任何东西。 可以通过一组快速的属性将Skeleton组件操纵为基本形状。 虽然可以在任一图表之上构建图表,但我最喜欢的图表构建组件是LinearProgress和CircularProgress 。
馅饼和甜甜圈 (Pie and Donut)
LinearProgress and CircularProgress components are commonly used as drop-in solutions for loading animation between page renders. They are also surprisingly versatile.
LinearProgress和CircularProgress组件通常用作在页面渲染之间加载动画的嵌入式解决方案。 它们还具有惊人的通用性。
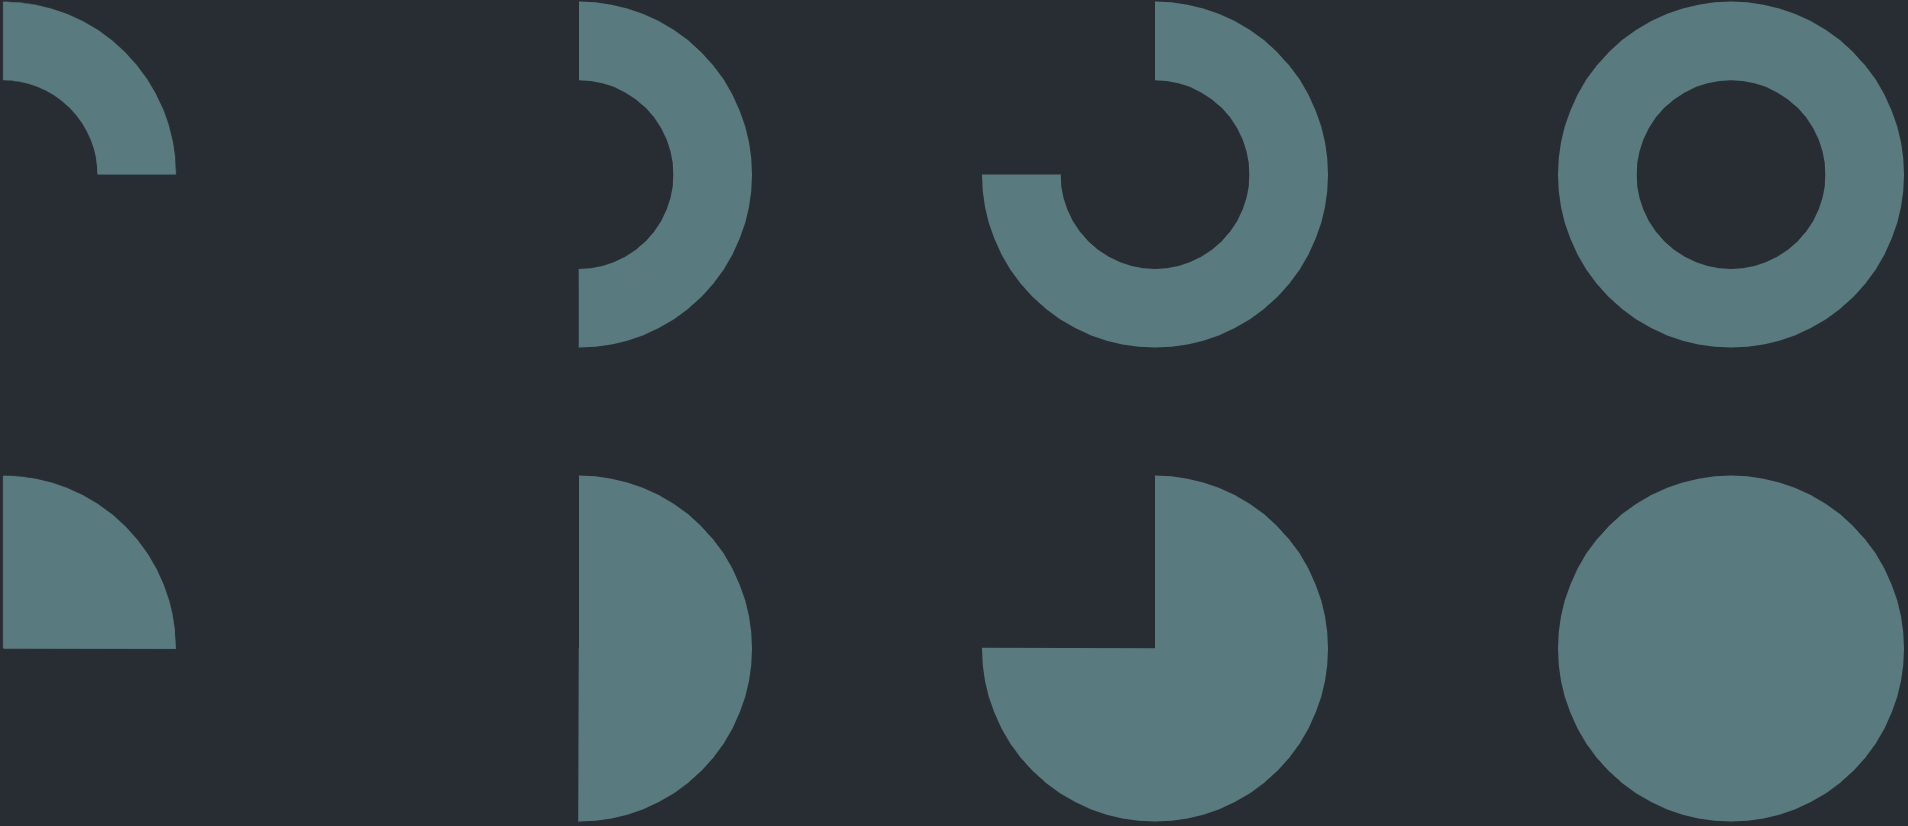
CircularProgress component essentially draws a circle repeatedly in a loop, where you can control the animation, the thickness of the line, and where that line ends. In other words, you can practically build any pie or donut-shaped chart.
CircularProgress组件本质上是在循环中重复绘制一个圆,您可以在其中控制动画,线的粗细以及该线的结束位置。 换句话说,您几乎可以构建任何饼形或甜甜圈形的图表。
import React from 'react';
import CircularProgress from '@material-ui/core/CircularProgress';interface DonutProps {
  value: number;
  size: number;
};const Donut: React.SFC<DonutProps> = ({
  value,
  size,
}) => {
  return (
    <CircularProgress
      size={`${size}%`}
      value={value}
      thickness={10}
      variant="static"
      color="primary"
    />
  );
};export default Donut;
This simple functional component leverages the static variant of CircularProgress. The thickness is set to 10 so that it would appear in donut-shaped, and the value indicates the percentage of completeness of the circle.
这个简单的功能组件利用了CircularProgress的静态变体。 厚度设置为10 ,使其以甜甜圈形状显示,该值表示圆的完整性百分比。
If we increase the thickness to 22, the line would fill out the hollow center and turns it into a solid pie chart.
如果将厚度增加到22 ,该线将填满空心中心并将其变成实心饼图。

酒吧 (Bar)
Similarly, a bar chart can be achieved with LinearProgress. While you cannot set thickness on a LinearProgress component out of the box, you could override its root class and adjusts the height of the progress bar.
同样,可以使用LinearProgress实现条形图。 尽管您无法直接在LinearProgress组件上设置厚度,但可以覆盖其根类并调整进度条的高度。
import React from 'react';
import LinearProgress from '@material-ui/core/LinearProgress';import { makeStyles, } from '@material-ui/core/styles';const useStyles = makeStyles(theme => ({
  root: {
    height: theme.spacing(4),
    backgroundColor: theme.palette.background.default,
  },
}));interface BarProps {
  value: number;
};const Bar: React.SFC<BarProps> = ({
  value,
}) => {
  const classes = useStyles();  return (
    <LinearProgress
      variant="determinate"
      value={value}
      classes={{
        root: classes.root,
      }}
    />
  );
};export default Bar;
比例尺 (Scaled Bar)
If you are looking to build slightly more advanced charts, you may want to consider other Material-UI components. Slider, Stepper, and Timeline let you add scales and labels to your continuous or dotted lines. Below is an example of a functional component that draws a scaled bar chart using a Slider.
如果您希望构建稍微更高级的图表,则可能需要考虑其他Material-UI组件。 使用Slider , Stepper和Timeline可以将刻度和标签添加到连续或虚线。 以下是使用滑块绘制比例条形图的功能组件示例。
import React from 'react';
import Slider from '@material-ui/core/Slider';import { makeStyles, } from '@material-ui/core/styles';const useStyles = makeStyles(theme => ({
  root: {
    height: theme.spacing(4),
  },
  rail: {
    height: theme.spacing(4),
  },
  track: {
    height: theme.spacing(4),
  },
  mark: {
    height: theme.spacing(4),
    backgroundColor: theme.palette.background.default,
  },
  thumb: {
    display: 'none',
  },
}));interface ScaledBarProps {
  value: number;
};const ScaledBar: React.SFC<ScaledBarProps> = ({
  value,
}) => {
  const classes = useStyles();  return (
    <Slider
      value={value}
      step={10}
      min={0}
      max={100}
      marks
      valueLabelDisplay="off"
      classes={{
        root: classes.root,
        rail: classes.rail,
        track: classes.track,
        thumb: classes.thumb,
        mark: classes.mark,
      }}
    />
  );
};export default ScaledBar;
径向棒 (Radial Bar)
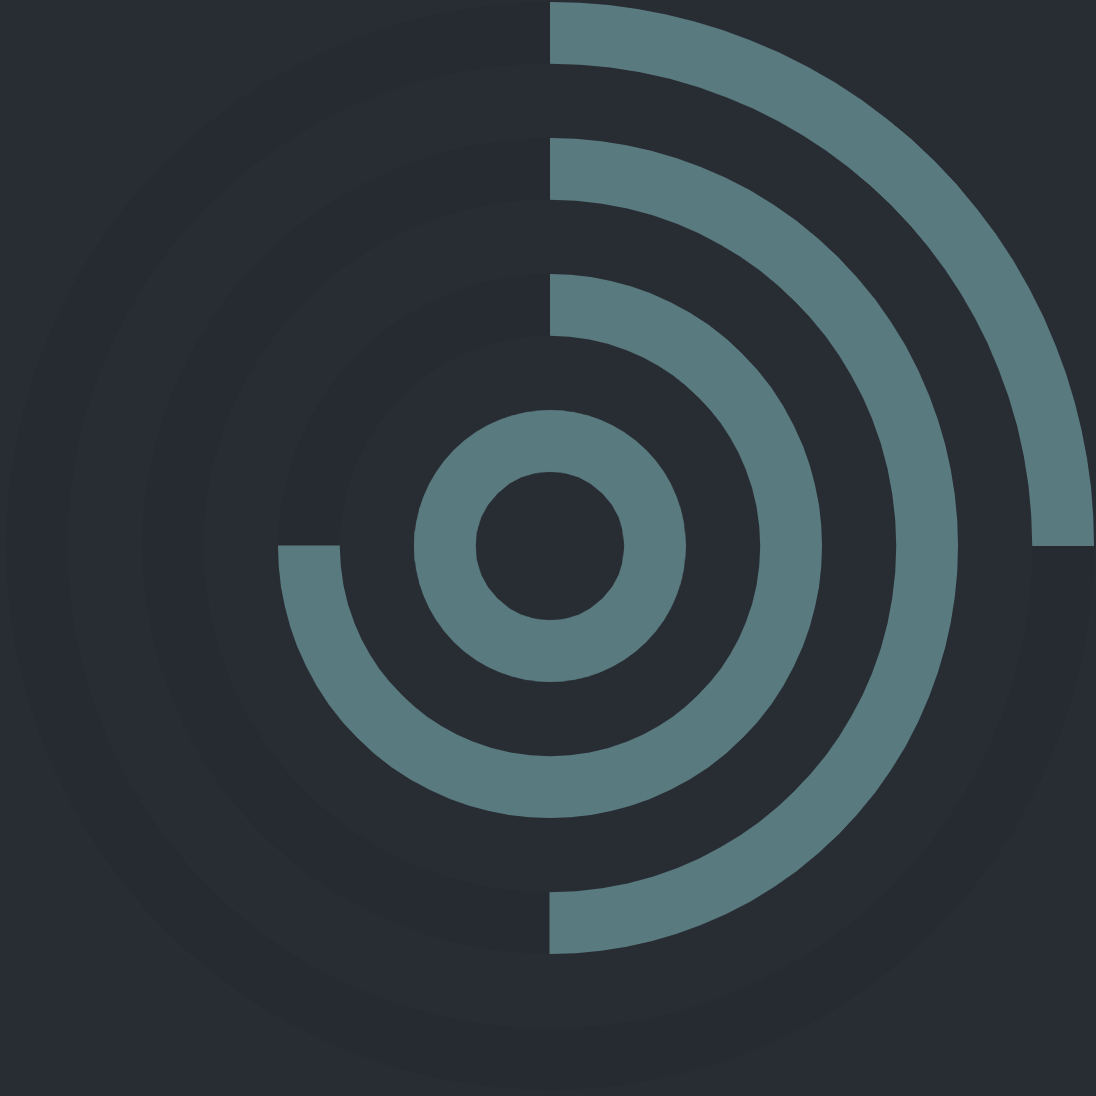
The last chart I would like to showcase here is the Radial Bar chart, which is essentially a stack of circles. The important lesson here is to know that you can use CSS to compose these charts together to create an even richer visual experience.
我要在这里展示的最后一个图表是“径向条形图”,它本质上是一堆圆圈。 这里的重要一课是要知道您可以使用CSS将这些图表组合在一起,以创建更加丰富的视觉体验。
For this example, I am using the grid layout to stack the circles on top of one another, and calculate the size and thickness of inner circles dynamically based on the number of circles we want to draw.
在此示例中,我使用grid布局将各个圆叠加在一起,并根据要绘制的圆数动态计算内部圆的大小和厚度。
import React from 'react';import Box from '@material-ui/core/Box';
import CircularProgress from '@material-ui/core/CircularProgress';import { makeStyles, } from '@material-ui/core/styles';interface RadialBarProps {
  values: number[],
};const RadialBar: React.SFC<RadialBarProps> = ({
  values
}) => {
  const useStyles = makeStyles(theme => ({
    root: {
      display: 'grid',
      alignItems: 'center',
      padding: theme.spacing(2),
    },
    circle: {
      gridRow: 1,
      gridColumn: 1,
      display: 'grid',
      alignItems: 'center',
      height: '100%',
      width: '100%',
    },
    bar: {
      gridRow: 1,
      gridColumn: 1,
      margin: '0 auto',
      zIndex: 1,
    },
    track: {
      gridRow: 1,
      gridColumn: 1,
      margin: '0 auto',
      color: theme.palette.action.hover,
    },
  }));  const classes = useStyles();  return (
    <Box
      className={classes.root}
    >
      {
        values.map((value: number, index: number) => {
          const size = 100 - index / values.length * 100;
          const thickness = (10 / values.length) * 10 / (10 - index * (10 / values.length));return (
            <Box
              key={index}
              className={classes.circle}
            >
              <CircularProgress
                size={`${size}%`}
                value={value}
                thickness={thickness}
                variant="static"
                color="primary"
                className={classes.bar}
              />
              <CircularProgress
                size={`${size}%`}
                value={100}
                thickness={thickness}
                variant="static"
                className={classes.track}
              />
            </Box>
          );
        })
      }
    </Box>
  );
};export default RadialBar;
最后的想法 (Final Thoughts)
You may ultimately have to use one of Recharts, Victory, Nivo, or React Vis if you want to implement sophisticated charts. Nevertheless, I hope this post encourages you to follow the principle of deferring commitment in Lean or YAGNI in Extreme Programming— wait until you have a better grasp of the problem you are trying to solve before investing in a decision.
如果要实现复杂的图表,最终可能必须使用Recharts , Victory , Nivo或React Vis之一 。 但是,我希望这篇文章鼓励您遵循“延迟编程”中精益或YAGNI中延迟承诺的原则-等到您对要解决的问题有更好的了解之后再进行决策。
You can find all the code examples in this repository. If you want to learn more about CSS Grid, I highly recommend this guide on CSS Tricks.
您可以在此存储库中找到所有代码示例。 如果您想了解有关CSS Grid的更多信息,我强烈建议您使用CSS Tricks上的本指南 。
翻译自: https://medium.com/swlh/the-material-ui-chart-library-you-didnt-know-you-have-d9860f627b0
material-ui


 249
249

 被折叠的 条评论
为什么被折叠?


