


朴素贝叶斯用于
A common use of statistics in business is the A/B test. This type of test pits two versions of the same experience — like a website page — against one another. The research question is simple to state: which version is better?
统计在业务中的常见用法是A / B测试。 这种测试使具有相同体验的两个版本(例如网站页面)相互对立。 研究问题很容易陈述:哪个版本更好?
There are a panoply of tools and guides to assist this type of testing. This article looks at Bayesian analysis for A/B testing.
有大量工具和指南可协助此类测试。 本文着眼于A / B测试的贝叶斯分析。
分析核心 (The analytical core)
What is a probability? That question forges a fundamental schism in statistics.
几率是多少? 这个问题在统计学上形成了根本的分裂。
Bayesian statisticians interpret probabilities as the degree of belief about events. Our prior belief — based on almost all coins being fair — is the probability of Heads is 1/2. After flipping the coin, we update our belief with Bayes’ Theorem.
贝叶斯统计学家将概率解释为对事件的信任程度。 基于几乎所有硬币都是公平的,我们先前的信念是正面的概率为1/2。 掷硬币之后,我们用贝叶斯定理更新了我们的信念。
Suppose our interest is the arithmetic difference in conversion. As alternatives, we could choose the relative difference (‘lift’) or odds ratio.
假设我们的兴趣是转换中的算术差异。 作为替代方案,我们可以选择相对差异(“提升”)或优势比。
The Bayesian framework says: the difference is a random variable. Bayesian analysis has the same core:
贝叶斯框架说:差异是一个随机变量。 贝叶斯分析具有相同的核心:
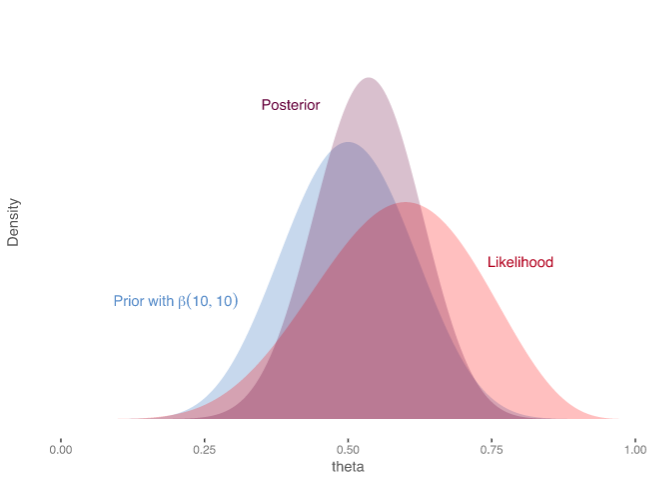
Prior distribution: state our prior beliefs as a probability distribution;
先验分布:将我们的先验信念描述为概率分布;
Receive data: we collect data, relating to our unknown parameters;
接收数据:我们收集与未知参数有关的数据;
Posterior distribution: update our beliefs, using Bayes’ Theorem, expressed as a probability distribution.
后验分布:使用贝叶斯定理(表示为概率分布)更新我们的信念。
The posterior probability is proportionate to the likelihood times the prior probability.
后验概率与可能性乘以先验概率成比例。
This is a unified approach to inference. The goal of this analytical core is the posterior distribution. We can summarise that posterior distribution, such as: the mean and credible intervals. From that distribution, we run hypothesis tests or apply decision rules. Decision rules can help minimise expected losses from making the wrong decision.
这是统一的推理方法。 该分析核心的目标是后验分布。 我们可以总结出后验分布,例如:均值和可信区间。 从该分布中,我们运行假设检验或应用决策规则。 决策规则可以帮助最大程度地减少因做出错误决策而造成的预期损失。
应用贝叶斯方法 (Applying a Bayesian approach)
Suppose we have 1,000 users on each of our two page versions. As we split users between pages, the two pages are independent of one another. Each user can convert or not convert. The data follows a Binomial distribution.
假设我们在两个页面版本中每个都有1,000个用户。 当我们在页面之间划分用户时,两个页面彼此独立。 每个用户都可以转换或不转换。 数据遵循二项分布。
With little information, we allow the conversion numbers to be anywhere between 0 and 1. We set two independent prior distributions which are uniform — with equal density from 0 to 1.
几乎没有信息,我们允许转换数在0到1之间。我们设置两个独立的先验分布,它们是均匀的-密度从0到1。
The uniform distribution is a special case of the Beta distribution: Beta(1, 1). The difference between these uniform distributions is a symmetric triangle, centred at zero.
均匀分布是Beta分布的一种特殊情况:Beta(1,1)。 这些均匀分布之间的差异是一个以零为中心的对称三角形。
The first version (A) had 300 conversions. The second version (B) had 340 conversions. The difference in conversion ratios is 4 percentage points.
第一个版本(A)进行了300次转换。 第二个版本(B)进行了340次转换。 转化率的差异为4个百分点。
xA <- 300; nA <- 1000; alphaA <- 1; betaA <- 1
xB <- 340; nB <- 1000; alphaB <- 1; betaB <- 1
number_sims <- 50000
The Beta distribution is a conjugate prior of our Binomial data. That means the prior and posterior distributions are in the same family. The posterior distribution is also a Beta distribution.
Beta分布是我们二项式数据的共轭形式。 这意味着先验和后验分布在同一家族中。 后验分布也是Beta分布。
There is a simple updating rule. The posterior distributions are, for A and B: Beta(1 + 300, 1 + 1,000 − 300); Beta(1 + 340, 1 + 1,000 − 340).
有一个简单的更新规则。 对于A和B,后验分布为:Beta(1 + 300,1 + 1,000-300); Beta(1 + 340,1 + 1,000-340)。
alphaA_post <- alphaA + xA; betaA_post <- betaA + nA - xA
alphaB_post <- alphaB + xB; betaB_post <- betaB + nB - xB
There is a closed form for the difference of two general Beta distributions. It is not pretty. Instead, we can use R to run simulations of this difference:
有两种通用Beta分布之差的封闭形式。 这不漂亮。 相反,我们可以使用R运行这种差异的模拟:
pA <- rbeta(number_sims, alphaA_post, betaA_post)
pB <- rbeta(number_sims, alphaB_post, betaB_post)pB_minus_pA <- pB - pA %>% as_tibble()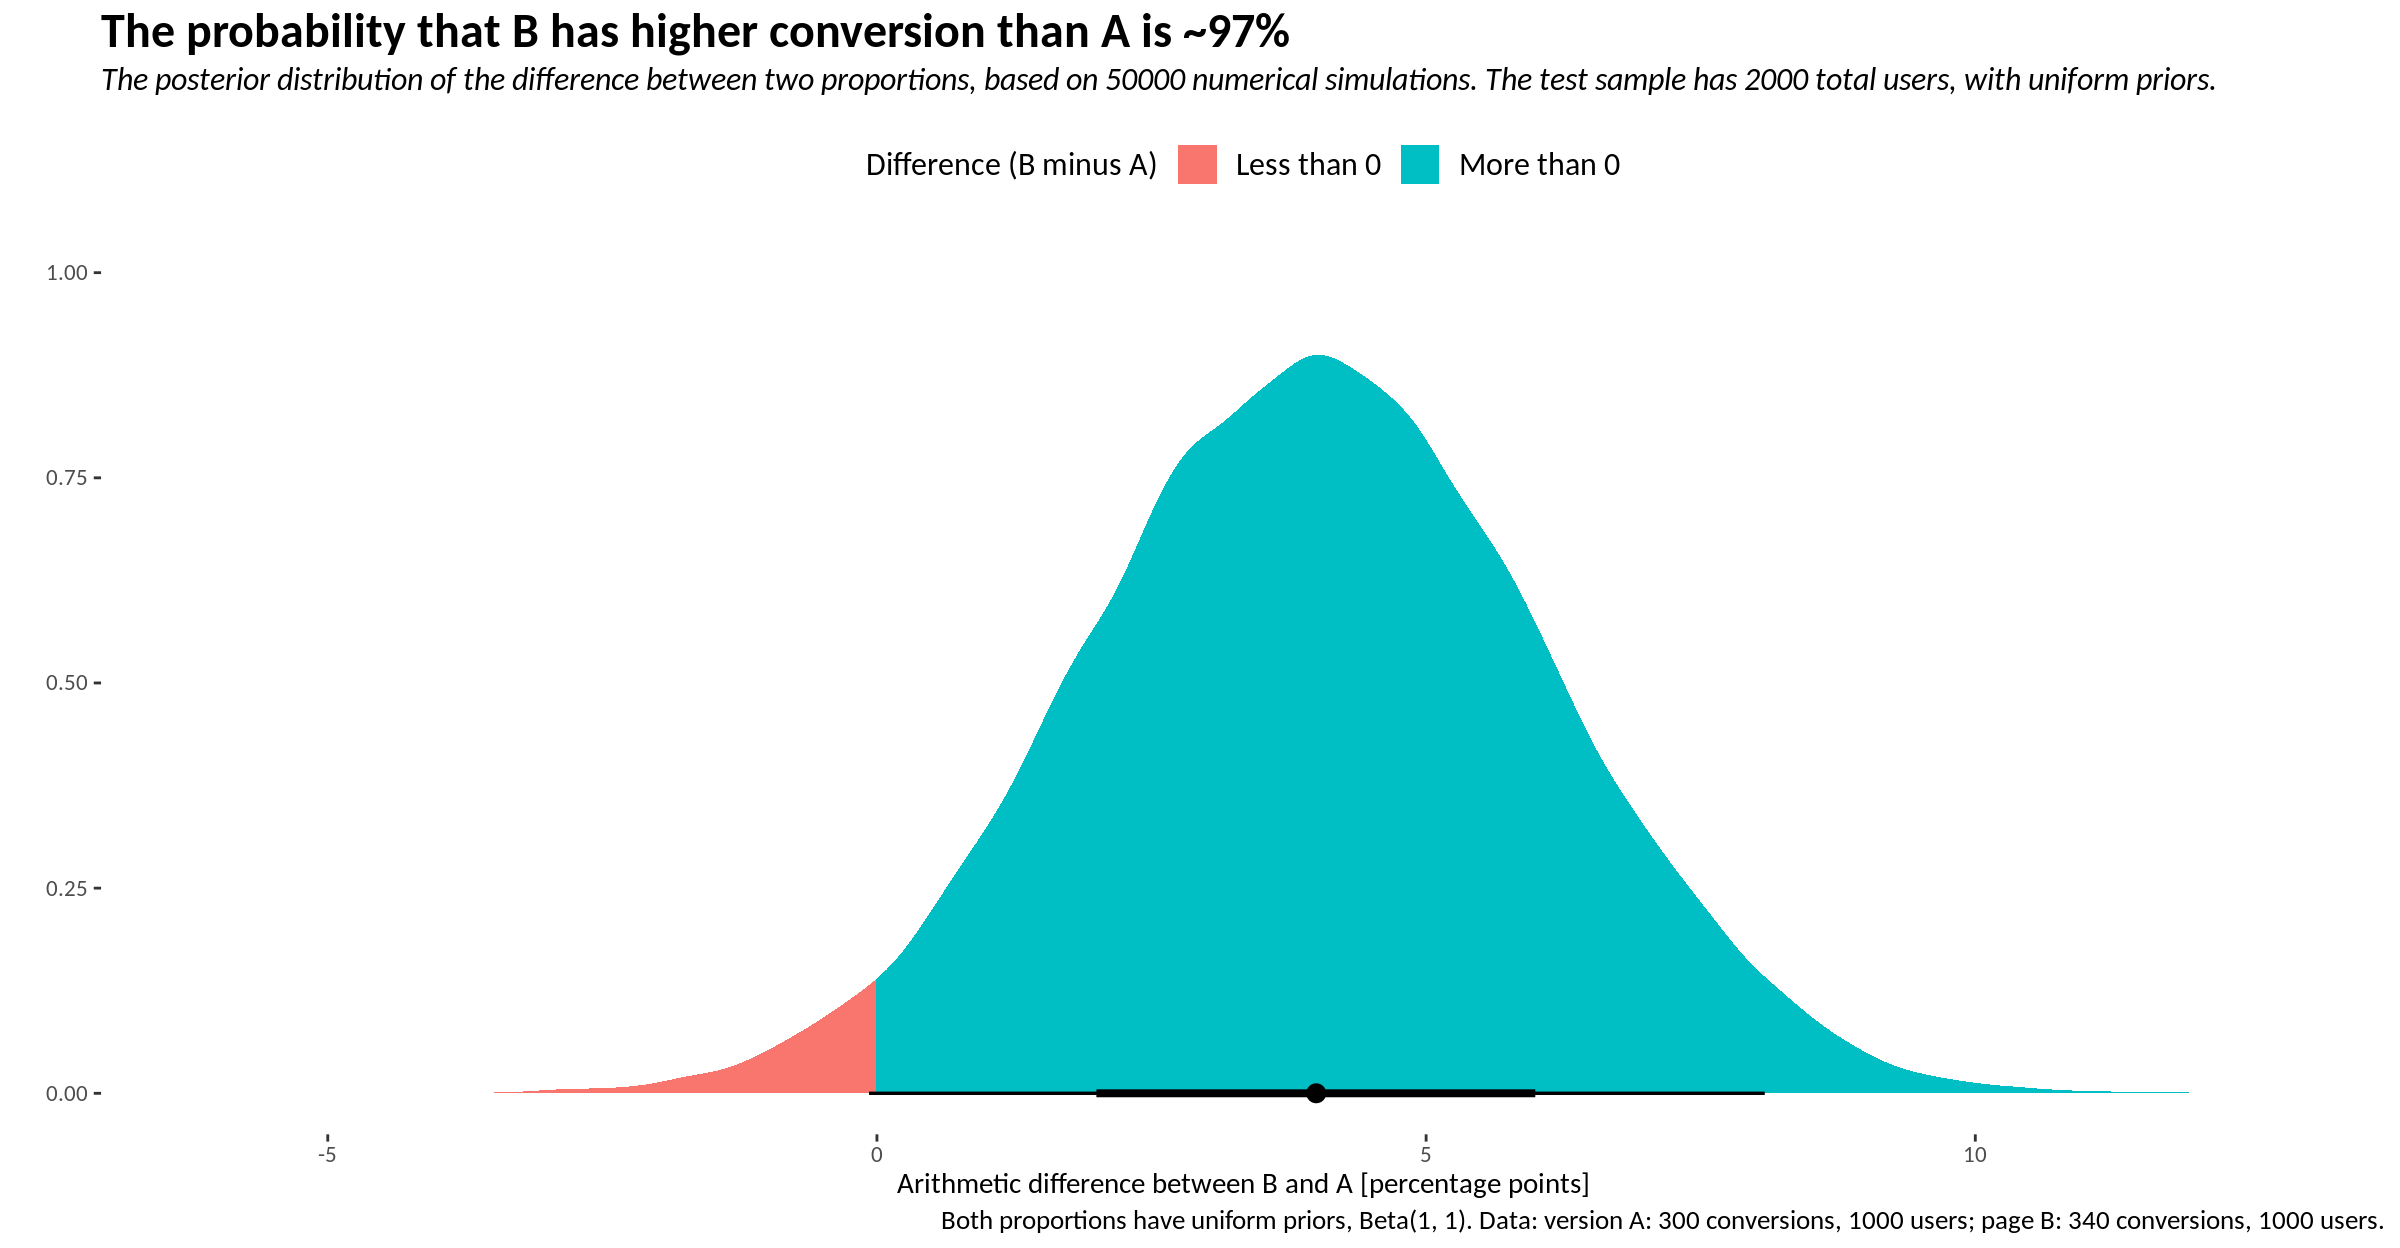
The probability that page B outperforms A is 97%. The 95% credible (mean quantile) interval for the difference is -0.1 to 8.1 points.
页面B胜过A的可能性为97%。 差异的95%可信(平均分位数)区间为-0.1至8.1点。
近似值和电子表格 (Approximations and spreadsheets)
We may not have access to an advanced statistics programme. Instead, analysts could only have a spreadsheet tool for their work.
我们可能无法使用高级统计程序。 相反,分析师只能使用电子表格工具进行工作。
We can still perform a Bayesian analysis using an approximation. For large samples, the posterior distribution resembles a Normal distribution. There are times where this approximation is inappropriate, such as with big asymmetries. In a 2010 JJSS article, Kawasaki and Miyaoka wrote about this approximation.
我们仍然可以使用近似值执行贝叶斯分析。 对于大样本,后验分布类似于正态分布。 有时这种近似是不合适的,例如具有很大的不对称性。 川崎和宫冈在2010年JJSS文章中发表了关于这种近似的文章。
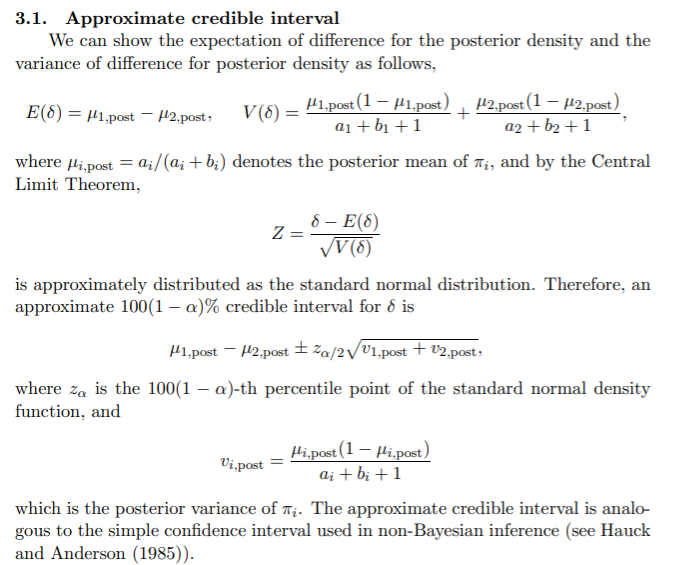
We can put that approximation into a spreadsheet, giving a credible interval. For this example, that 95% (highest density) interval is from -0.1 to 8.1 points. This is alike to both numerical methods and classical approximations.
我们可以将该近似值放入电子表格中,并给出可靠的间隔。 对于此示例,该95%(最高密度)间隔为-0.1至8.1点。 这与数值方法和经典近似都相同。
These calculations depend on the choice of prior distribution. An advantage of the Bayesian approach is the direct probability interpretation. Given our prior beliefs and the data, there is a 95% probability the difference lies in this interval.
这些计算取决于先验分布的选择。 贝叶斯方法的一个优点是直接概率解释。 根据我们先前的信念和数据,差异有95%的概率位于此区间内。
For this article, I used Prof Matthew Kay’s tidybayes package. There are some R packages that do A/B tests for you. It was important to understand each step, rather than plug numbers into a calculator. The code is available on GitHub and R Pubs.
在本文中,我使用了Matthew Kay教授的tidybayes软件包。 有些R软件包可以为您进行A / B测试。 重要的是要理解每个步骤,而不是将数字插入计算器。 该代码可在GitHub和R Pubs上获得。
翻译自: https://medium.com/@theintersectuk/bayesian-analysis-for-a-b-testing-a508932ac66c
朴素贝叶斯用于


 6138
6138


 被折叠的 条评论
为什么被折叠?
被折叠的 条评论
为什么被折叠?
 到【灌水乐园】发言


