


 本文介绍了如何识别和修复在使用LaTeX时表格中出现的虚线问题,源自一篇关于数据科学的文章。
latex 表格中虚线
When documents are digitalized via scanning or via photo, the image quality can suffer from wrong settings or bad conditions. In the case of table recognition, this can lead to a broken table structure. Consequently, some lines might have light flaws or even holes and the table as a whole is not recognized as a coherent system. Sometimes the tables are also created without lines on some sides of the cells. In this case, the system closes the lines with the lines of the cells above. There is a great variety of tables and cell types and as so often the proposed code might not work perfectly for all. Nonetheless, with small adaptations its useful for many cases.
通过扫描或照片对文档进行数字化处理时,图像质量可能会因设置错误或状况不佳而受到影响。 在表识别的情况下,这可能导致表结构损坏。 因此,某些生产线可能会出现光缺陷或什至有Kong,因此整个工作台无法识别为连贯的系统。 有时,表格的创建在单元格的某些侧面也没有线。 在这种情况下,系统用上面的单元格的行关闭行。 表和单元格类型多种多样,因此通常所提出的代码可能并不适合所有人。 但是,只需进行少量修改,它就可以在许多情况下使用。
Most cell recognition algorithms are based on lines and cell structure. Not having lines leads to a bad recognition rate due to “forgotten” cells. The same is the case for this approach. The lines are necessary. In case your table does not have clearly recognizable lines it won’t work. But now, let’s take a look at the code!
大多数细胞识别算法均基于细胞系和细胞结构。 由于“被遗忘”的细胞,没有线会导致不良的识别率。 这种方法也是如此。 线是必需的。 如果您的表格没有明显可识别的行,它将无法正常工作。 但是现在,让我们看一下代码!
First, we need to do the imports. In this case, it is restricted only to two imports: OpenCV and NumPy.
首先,我们需要进行进口。 在这种情况下,它仅限于两个导入:OpenCV和NumPy。
import cv2
import numpy as np
Then we need to load the image/document containing the table. In case it is a whole document with text surrounding the table you need to recognize the table first and cut the image to the table size. (To read more about table recognition and cutting to the table size, click here.)
然后,我们需要加载包含表的图像/文档。 如果是整个文档,并且表格周围有文字,则需要首先识别该表格,然后将图像切成表格大小。 (要了解有关表格识别和削减表格尺寸的更多信息, 请单击此处 。)
# Load the imageimage = cv2.imread(‘/Users/marius/Desktop/holes.png’, -1)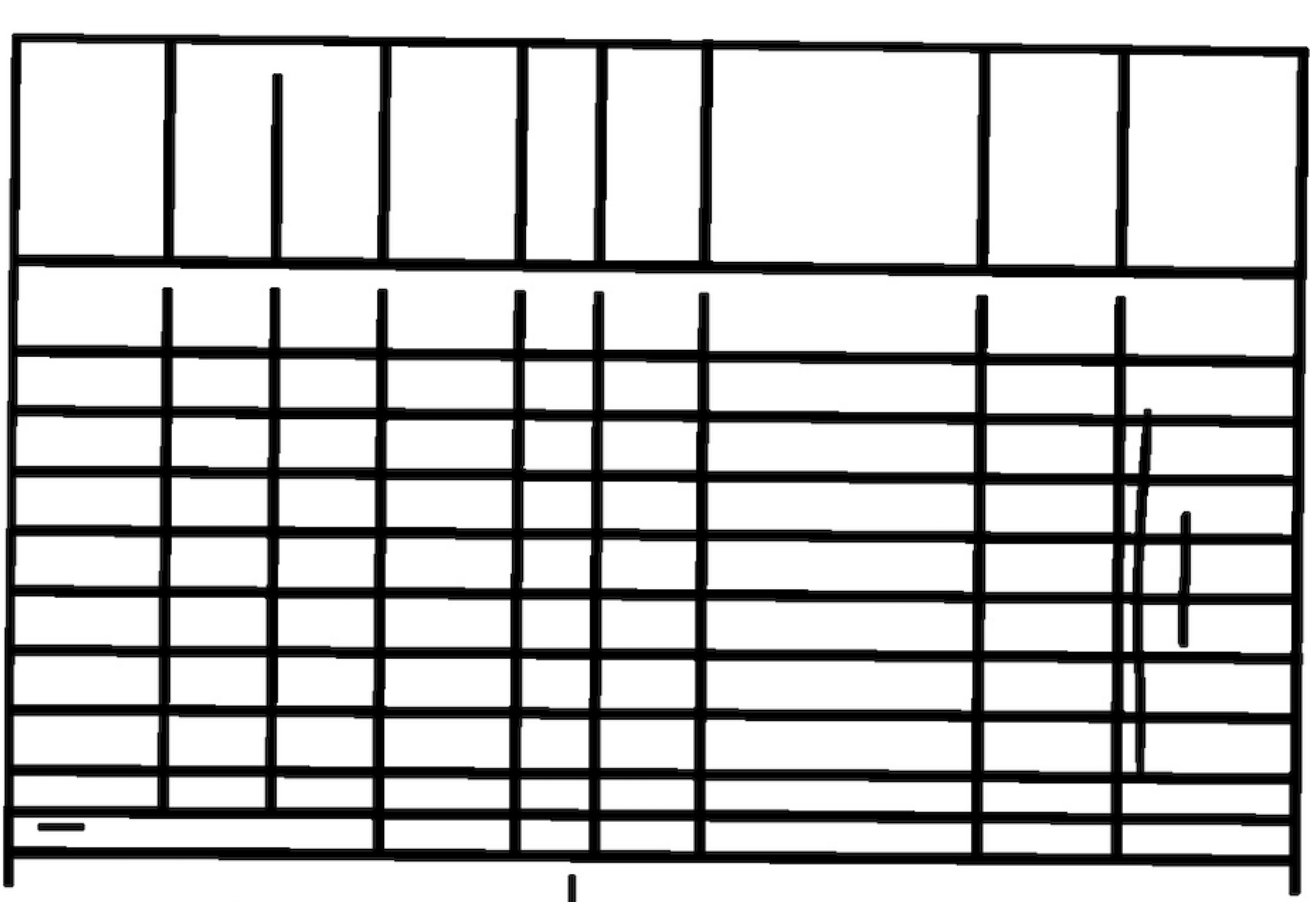
As you can see in the input image the lines of the cells in the second row are not fully connected. In table recognition, the second row would not be recognized and considered by the algorithm because the cells are not a closed box. The solution proposed in this article works not only for this case of gaps. It works also for other broken lines or holes in tables.
如您在输入图像中看到的,第二行中的单元格线未完全连接。 在表识别中,由于单元格不是封闭的框,因此算法将无法识别和考虑第二行。 本文提出的解决方案不仅适用于这种情况。 它也适用于表格中的其他虚线或Kong。
Now, we need to obtain the size of the image (height and width) and store it in the variables hei and wid.
现在,我们需要获取图像的大小(高度和宽度)并将其存储在变量hei和wid中。
(hei,wid,_) = image.shape The next step is the grayscaling and blurring via a Gaussian Filter. This helps in the recognition of the lines. For more on grayscaling, click here.
下一步是通过高斯滤镜进行灰度和模糊处理。 这有助于识别线条。 有关灰度的更多信息, 请单击此处 。
#Grayscale and blur the image
gray = cv2.cvtColor(image, cv2.COLOR_BGR2GRAY)
blur = cv2.GaussianBlur(gray, (3,3), 0)
Then we need to threshold our image. If you want to learn a bit more about thresholding, you can read about it in this article: Click Here (It’s all the way down to the section Binarizing an image).
然后,我们需要对图像进行阈值处理。 如果您想了解有关阈值的更多信息,可以在本文中阅读有关阈值的信息: 单击此处 (一直到“ 对图像进行二值化”部分)。
#Threshold the image
thresh = cv2.threshold(blur, 0, 255, cv2.THRESH_BINARY_INV + cv2.THRESH_OTSU)[1]
The findContours algorithm of OpenCV is then used to get the position of all contours. For all contours, a bounding rectangle is drawn to create the boxes/cells of the table. The boxes are then stored in the list box with the four values x, y, width, height.
然后使用OpenCVfindContours算法获取所有轮廓的位置。 对于所有轮廓,将绘制一个边界矩形以创建表格的框/单元格。 然后将这些框与四个值x,y,宽度,高度一起存储在列表框中。
#Retrieve contours
contours, hierarchy = cv2.findContours(thresh, cv2.RETR_TREE, cv2.CHAIN_APPROX_SIMPLE)#Create box-list
box = []# Get position (x,y), width and height for every contour for c in contours:
    x, y, w, h = cv2.boundingRect(c)
    box.append([x,y,w,h])
All heights, widths, x’s and y’s are then separately stored in lists and the minimum height, width and x and y are computed. Furthermore, the maximum y and x are necessary.
然后将所有高度,宽度,x和y分别存储在列表中,并计算最小高度,宽度以及x和y。 此外,最大y和x是必需的。
#Create separate lists for all values
heights=[]
widths=[]
xs=[]
ys=[]#Store values in listsfor b in box:
    heights.append(b[3])
    widths.append(b[2])
    xs.append(b[0])
    ys.append(b[1])#Retrieve minimum and maximum of listsmin_height = np.min(heights)
min_width = np.min(widths)
min_x = np.min(xs)
min_y = np.min(ys)
max_y = np.max(ys)
max_x = np.max(xs)
The stored values are now used to understand where the table is located. The minimum y value can be used to get the uppermost row of the table, which can be regarded as the starting point of the table. The minimum x value is the left edge of the table. To get the approximate size we need to retrieve the maximum y value, which is the cell or row at the bottom of the table. The y-value of the last row represents the upper edge of the cell and not the bottom of the cell. To regard the whole size of the cell and the table it is necessary to add the last rows cell height to the maximum y to retrieve the full height of the table. The maximum x will be the last column and consecutively, the right-most cell/row of the table. The x-value is the left edge of each cell and consecutively, we need to add the width of the last column to the maximum x-value to retrieve the full width of the table.
现在使用存储的值来了解表的位置。 最小y值可用于获取表的最上一行,该行可以视为表的起点。 x的最小值是表格的左边缘。 要获得近似大小,我们需要检索最大y值,该值是表底部的单元格或行。 最后一行的y值表示单元格的上边缘,而不是单元格的底部。 要考虑单元格和表格的整体大小,必须将最后一行的单元格高度加到最大y以检索表格的完整高度。 最大的x将是表格的最后一列,并连续地是表格的最右边的单元格/行。 x值是每个单元格的左边缘,并且连续地,我们需要将最后一列的宽度添加到最大x值以检索表的完整宽度。
#Retrieve height where y is maximum (edge at bottom, last row of table)
for b in box:
    if b[1] == max_y:
        max_y_height = b[3]#Retrieve width where x is maximum (rightmost edge, last column of table)for b in box:
    if b[0] == max_x:
        max_x_width = b[2]
In the next step, all horizontal and vertical lines are extracted and stored separately. This is done by creating a kernel which thresholds and applies morphological operations. The horizontal kernel has a size of (50,1). You can play around with the size depending on the size of your image. The vertical kernel has a size of (1,50).
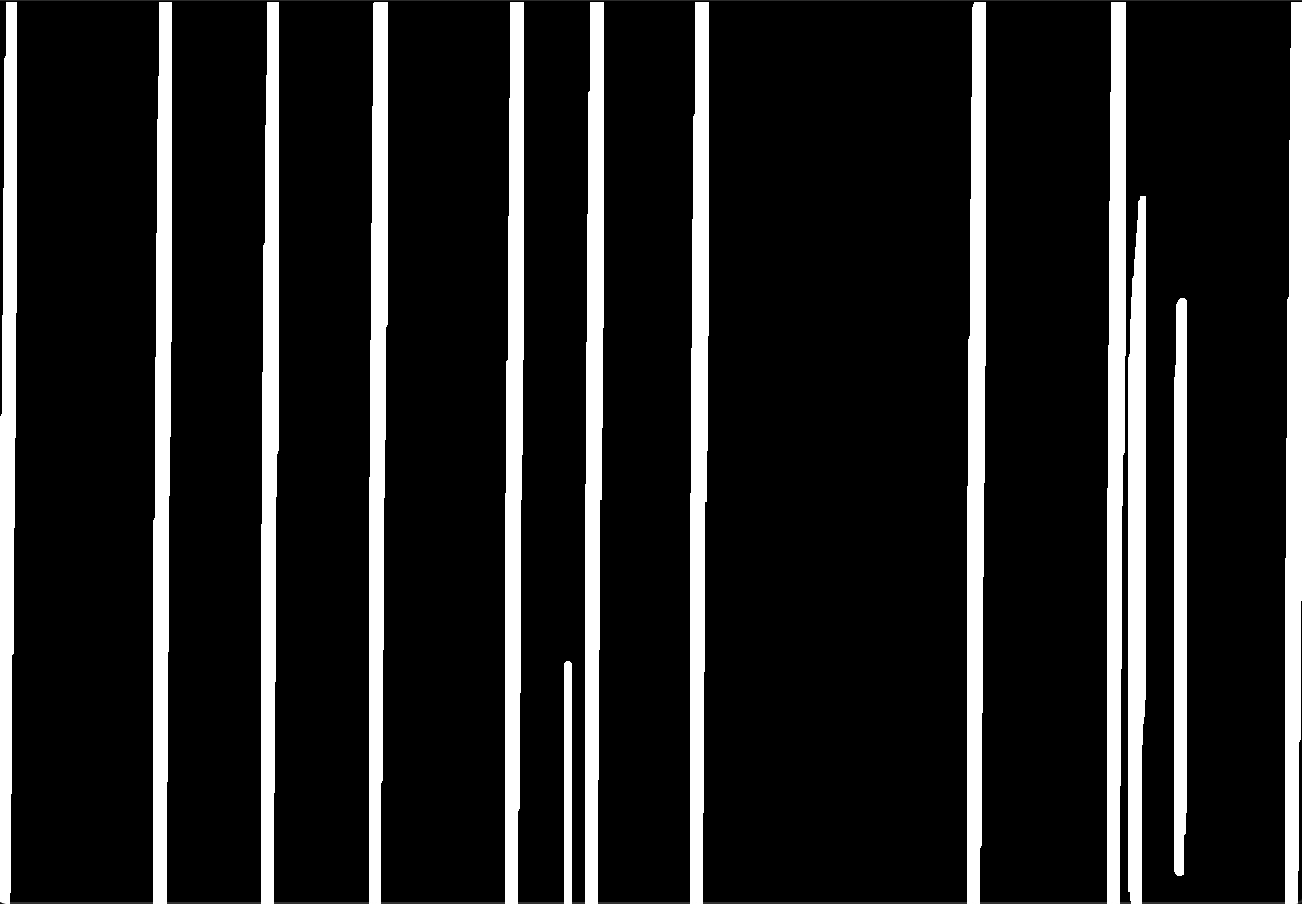
在下一步中,将提取所有水平线和垂直线并分别存储。 这是通过创建一个阈值并应用形态运算的内核来完成的。 水平内核的大小为(50,1)。 您可以根据图像的大小来调整大小。 垂直内核的大小为(1,50)。
Morphological operations perform transformations of the detected structures based on their geometry (Soille, p.50, 1998). Dilation is one of the most applied and most basic morphological operations. If at least one pixel under the kernel is white, the pixel being viewed of the original image will be considered white. Consequently, the white areas are enlarged. Please be aware that due to inversion the background is black and foreground white, meaning that the table lines are currently white. The dilation can be seen as the most important step. The holes and broken lines are now repaired and for further table recognition, all cells will be regarded.
形态学操作根据检测到的结构的几何形状进行转换(Soille,第50页,1998年)。 扩张是应用最广泛,最基本的形态学操作之一。 如果内核下的至少一个像素为白色,则原始图像的正在查看的像素将被视为白色。 因此,白色区域变大了。 请注意,由于反转,背景为黑色,前景为白色,这意味着表格行当前为白色。 扩张可以被视为最重要的步骤。 现在修复Kong和虚线,为了进一步识别表,将考虑所有单元格。
# Obtain horizontal lines maskhorizontal_kernel = cv2.getStructuringElement(cv2.MORPH_RECT, (50,1))
horizontal_mask = cv2.morphologyEx(thresh, cv2.MORPH_OPEN, horizontal_kernel, iterations=1)
horizontal_mask = cv2.dilate(horizontal_mask, horizontal_kernel, iterations=9)# Obtain vertical lines mask
vertical_kernel = cv2.getStructuringElement(cv2.MORPH_RECT, (1,50))
vertical_mask = cv2.morphologyEx(thresh, cv2.MORPH_OPEN, vertical_kernel, iterations=1)
vertical_mask= cv2.dilate(vertical_mask, vertical_kernel, iterations=9)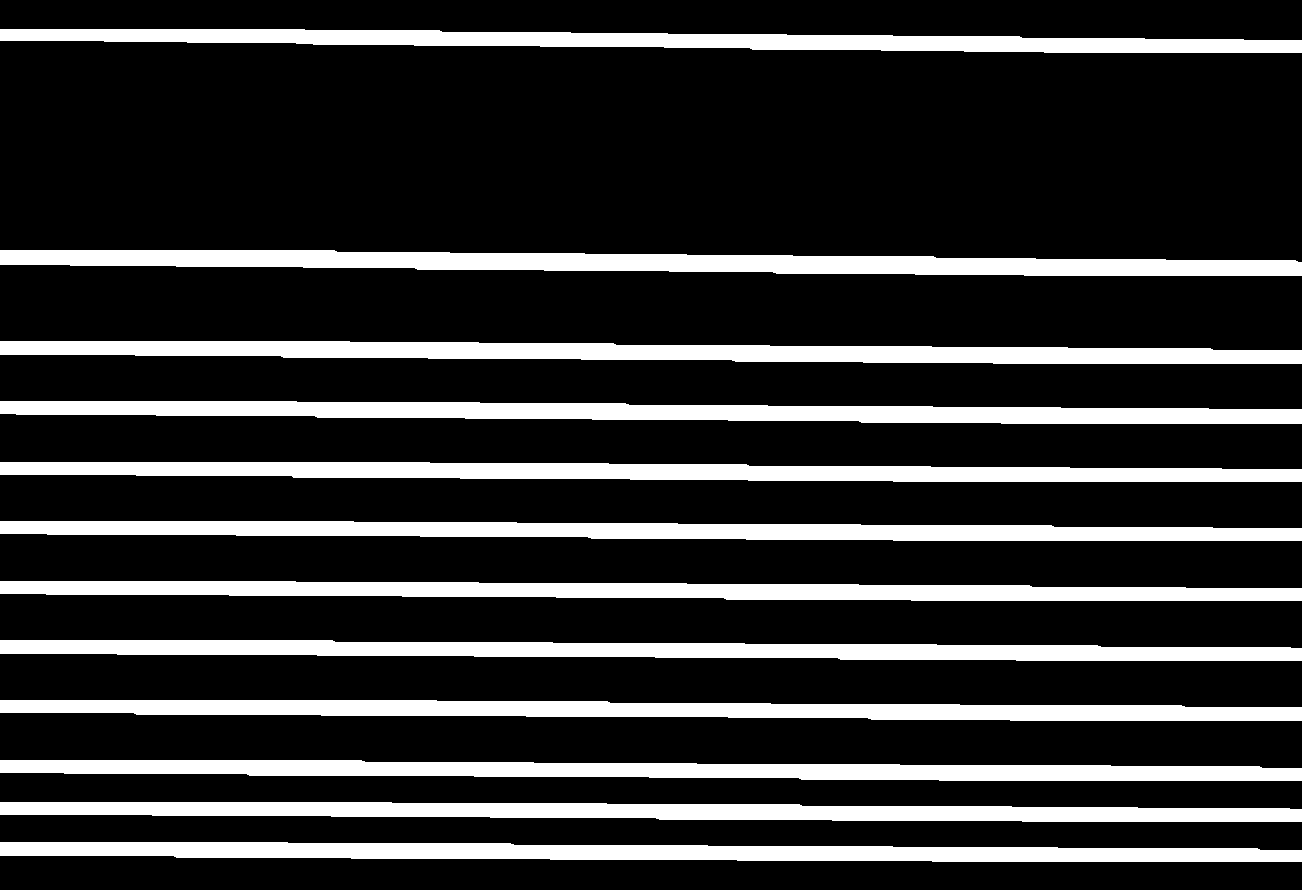
Both masks, the horizontal and the vertical, are then merged to one table using the bitwise_or operation of OpenCV. To retrieve the original back- and foreground the image is inverted by subtracting the cv2.bitwise_or from 255.
然后使用OpenCVbitwise_or操作将水平和垂直两个蒙版合并到一张表中。 要检索原始的前后前景,可通过从255中减去cv2.bitwise_or来反转图像。
# Bitwise-and masks together
result = 255 — cv2.bitwise_or(vertical_mask, horizontal_mask)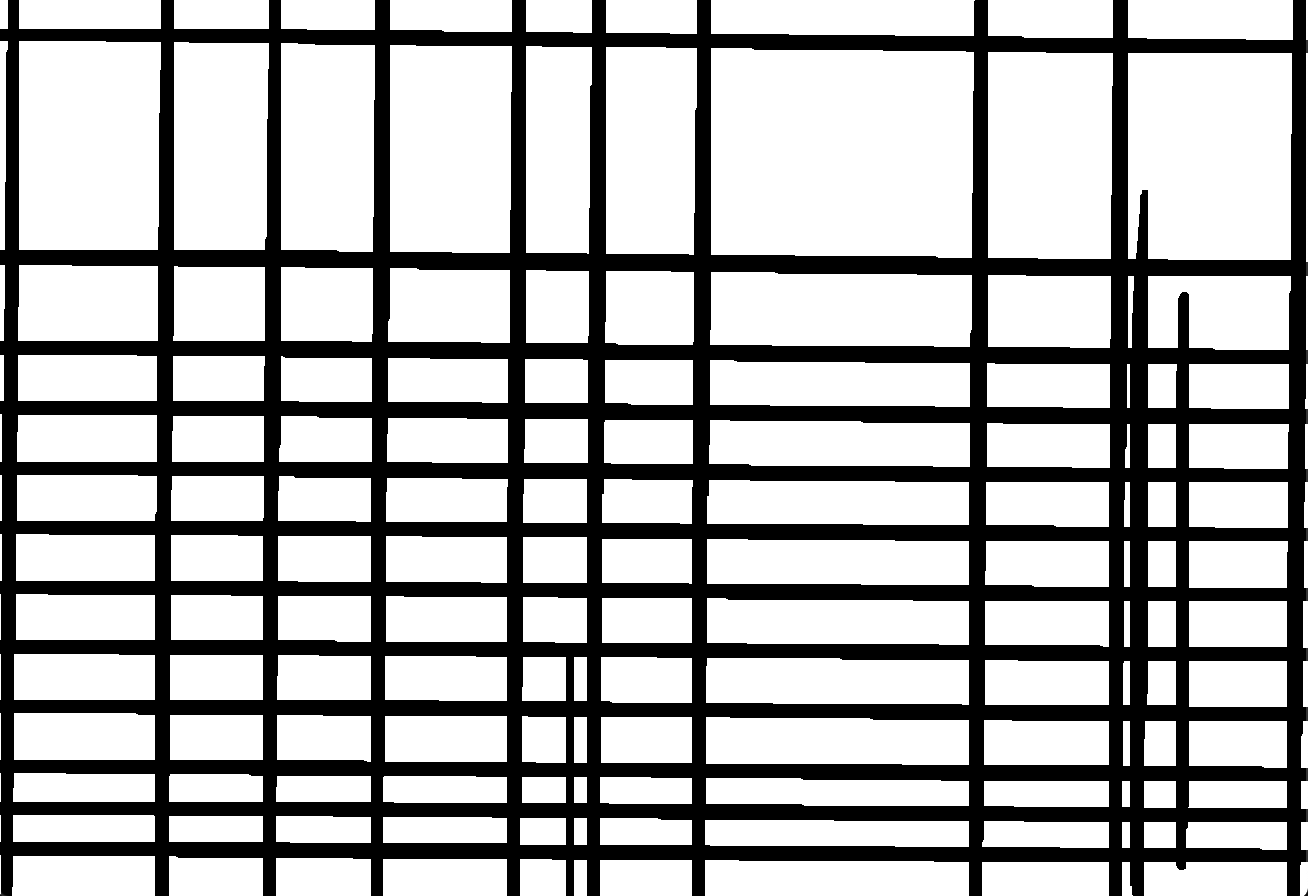
In case the table is surrounded by text and not standing alone (in my example it’s not surrounded), we cut it out and set it on a white background. Now we need the size of the table retrieved earlier. We cut the final image to the table size by using the minimum y (which is the edge at top), the maximum y + the height of the maximum y cells (which is the edge at the bottom), the minimum x (which is the left edge) and the maximum x + the width of the maximum x cells (which is the right edge). The image is then cropped to the size of the table. A new background of the original size of the document is created and completely filled with white pixels. The center of the image is retrieved and the repaired table is merged with the white background and set right into the center of the image.
如果桌子被文本包围而不是一个人站立(在我的示例中,它没有被包围),我们将其剪下并放在白色背景上。 现在我们需要前面检索的表的大小。 我们使用最小y(顶部的边缘),最大y +最大y单元格的高度(底部的边缘),最小x(即左边缘)和最大x +最大x个像元的宽度(这是右边缘)。 然后将图像裁剪为表格的大小。 将创建文档原始大小的新背景,并完全用白色像素填充。 检索图像的中心,将修复后的表格与白色背景合并,并设置在图像的中心。
#Cropping the image to the table size
crop_img = result[(min_y+5):(max_y+max_y_height), (min_x):(max_x+max_x_width+5)]#Creating a new image and filling it with white backgroundimg_white = np.zeros((hei, wid), np.uint8)
img_white[:, 0:wid] = (255)#Retrieve the coordinates of the center of the image
x_offset = int((wid — crop_img.shape[1])/2)
y_offset = int((hei — crop_img.shape[0])/2)#Placing the cropped and repaired table into the white background
img_white[ y_offset:y_offset+crop_img.shape[0], x_offset:x_offset+crop_img.shape[1]] = crop_img#Viewing the result
cv2.imshow(‘Result’, img_white)
cv2.waitKey()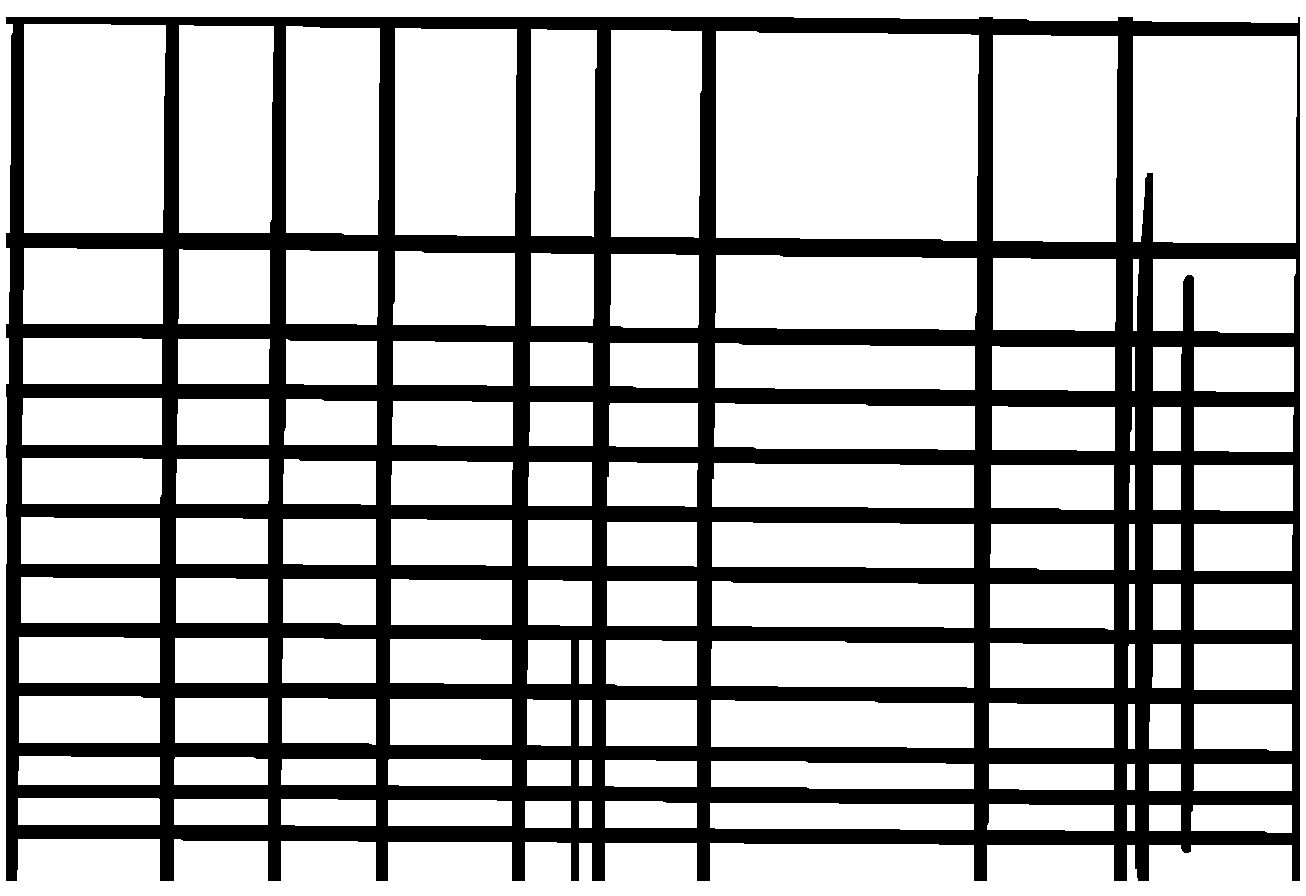
This is the result. The method can be used for multiple typed of broken lines, gaps, and holes in tables. The result is the basis for further table recognition as explained in my other article. The explained method was applied on an empty table. You can also apply it on a table containing text or surrounded by text. For a table containing text, it is still necessary to merge the original image containing a table with data with the final image with repaired holes. This can be done with a OpenCV bitwise operation and should not be to complex.
这就是结果。 该方法可用于表格中的虚线,间隙和Kong的多种类型。 结果是进一步的表识别的基础,正如我在另一篇文章中所解释的。 解释的方法应用于空表。 您也可以将其应用于包含文本或被文本包围的表上。 对于包含文本的表,仍然有必要将包含表的原始图像与数据与具有修复Kong的最终图像合并。 这可以通过OpenCV按位操作来完成,并且不应太复杂。
I hope you enjoyed my tutorial and can use this for your own projects.
希望您喜欢我的教程,并可以将其用于自己的项目。
latex 表格中虚线


 4730
4730

 被折叠的 条评论
为什么被折叠?
被折叠的 条评论
为什么被折叠?
 到【灌水乐园】发言


