


 这篇博客是针对Python编程初学者的情绪分析指南,介绍了如何在Python中进行情绪分析的基础知识。
python编程初学者指南
什么是情绪分析? (What is sentiment analysis?)
Sentiment analysis is a technique that detects the underlying sentiment in a piece of text.
情感分析是一种检测文本中潜在情感的技术。
It is the process of classifying text as either positive, negative, or neutral. Machine learning techniques are used to evaluate a piece of text and determine the sentiment behind it.
这是将文本分类为肯定,否定或中性的过程。 机器学习技术用于评估一段文本并确定其背后的情感。
为什么情绪分析有用? (Why is sentiment analysis useful?)
Sentiment analysis is essential for businesses to gauge customer response.
情绪分析对于企业衡量客户React至关重要。
Picture this: Your company has just released a new product that is being advertised on a number of different channels.
想象一下 :贵公司刚刚发布了一种新产品,该产品正在许多不同的渠道上进行广告宣传。
In order to gauge customer’s response to this product, sentiment analysis can be performed.
为了评估客户对此产品的React,可以进行情感分析。
Customers usually talk about products on social media and customer feedback forums. This data can be collected and analyzed to gauge overall customer response.
客户通常在社交媒体和客户反馈论坛上谈论产品。 可以收集和分析此数据以评估总体客户响应。
Taking this a step further, trends in the data can also be examined. For example, customers of a certain age group and demographic may respond more favourably to a certain product than others.
更进一步,还可以检查数据趋势。 例如,某个年龄段和特定人群的客户对某种产品的响应可能会比其他产品更好。
Based on the information collected, companies can then position the product differently or change their target audience.
根据收集到的信息,公司可以对产品进行不同的定位或更改其目标受众。
分析 (The Analysis)
In this article, I will guide you through the end to end process of performing sentiment analysis on a large amount of data.
在本文中,我将指导您完成对大量数据进行情感分析的端到端过程。
We will be using the Reviews.csv file from Kaggle’s Amazon Fine Food Reviews dataset to perform the analysis.
我们将使用Reviews.csv 来自Kaggle的Amazon Fine Food Reviews数据集的文件以执行分析。
I use a Jupyter Notebook for all analysis and visualization, but any Python IDE will do the job.
我使用Jupyter Notebook进行所有分析和可视化,但是任何Python IDE都能胜任。
步骤1:读取资料框 (Step 1: Read the Dataframe)
import pandas as pd
df = pd.read_csv('Reviews.csv')
df.head()
Checking the head of the dataframe:
检查数据框的头部:
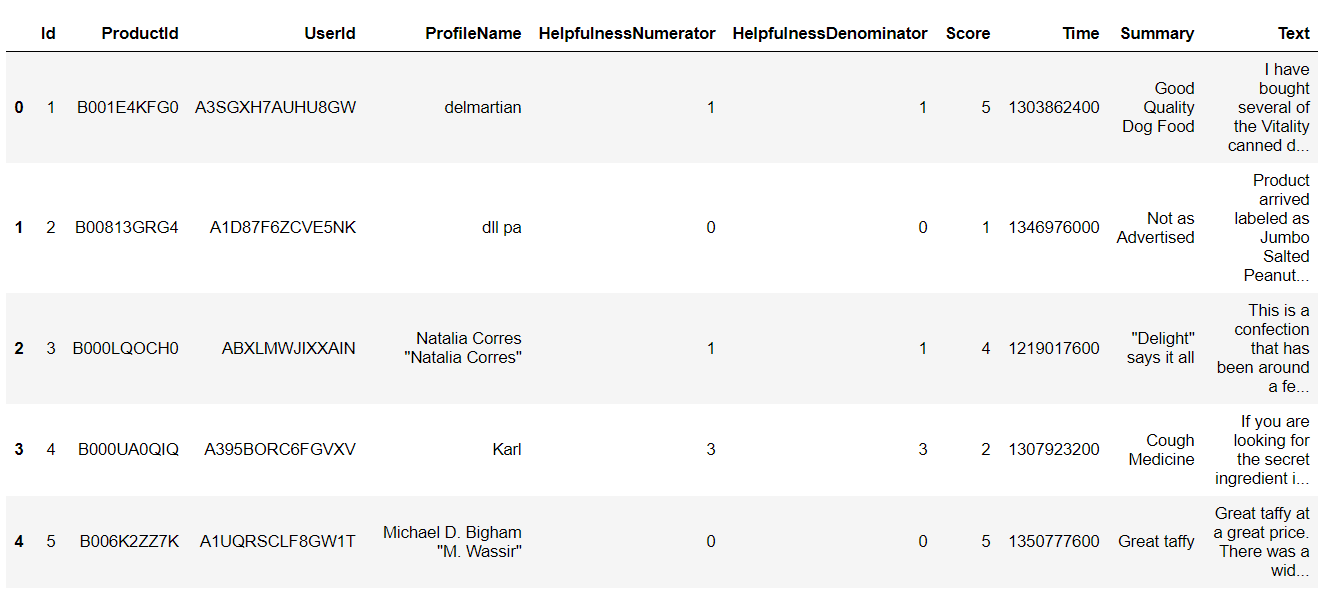
We can see that the dataframe contains some product, user and review information.
我们可以看到数据框包含一些产品,用户和评论信息。
The data that we will be using most for this analysis is “Summary”, “Text”, and “Score.”
我们将在此分析中最常用的数据是“ 摘要”, “ 文本”和“ 得分”。
Text — This variable contains the complete product review information.
文本 -此变量包含完整的产品评论信息。
Summary — This is a summary of the entire review.
摘要 -这是整个评论的摘要。
Score — The product rating provided by the customer.
评分-客户提供的产品评分。
步骤2:资料分析 (Step 2: Data Analysis)
Now, we will take a look at the variable “Score” to see if majority of the customer ratings are positive or negative.
现在,我们将查看变量“ Score ”,以查看大多数客户的评价是正面还是负面。
To do this, you will have to install the Plotly library first.
为此,您必须首先安装Plotly库 。
# Importsimport matplotlib.pyplot as plt
import seaborn as sns
color = sns.color_palette()
%matplotlib inline
import plotly.offline as py
py.init_notebook_mode(connected=True)
import plotly.graph_objs as go
import plotly.tools as tls
import plotly.express as px# Product Scoresfig = px.histogram(df, x="Score")
fig.update_traces(marker_color="turquoise",marker_line_color='rgb(8,48,107)',
                  marker_line_width=1.5)
fig.update_layout(title_text='Product Score')
fig.show()
The resulting plot looks like this:
结果图如下:

From here, we can see that most of the customer rating is positive. This leads me to believe that most reviews will be pretty positive too, which will be analyzed in a while.
从这里,我们可以看到大多数客户评价是正面的。 这使我相信,大多数评论也将是非常积极的,将在一段时间内进行分析。
Now, we can create some wordclouds to see the most frequently used words in the reviews.
现在,我们可以创建一些词云,以查看评论中最常用的词。
import nltk
from nltk.corpus import stopwords# Create stopword list:
stopwords = set(STOPWORDS)
stopwords.update(["br", "href"])
textt = " ".join(review for review in df.Text)
wordcloud = WordCloud(stopwords=stopwords).generate(textt)plt.imshow(wordcloud, interpolation='bilinear')
plt.axis("off")
plt.savefig('wordcloud11.png')
plt.show()
Running the code above generates a word cloud that looks like this:
运行上面的代码将生成一个词云,如下所示:

Some popular words that can be observed here include “taste,” “product,” “love,” and “Amazon.” These words are mostly positive, also indicating that most reviews in the dataset express a positive sentiment.
在这里可以观察到的一些流行词包括“ 口味 ”,“ 产品 ”,“ 爱 ”和“ 亚马逊” 。 这些词大多是正面的,也表明数据集中的大多数评论都表达了正面的情绪。
步骤3:分类推文 (Step 3: Classifying Tweets)
In this step, we will classify reviews into “positive” and “negative,” so we can use this as training data for our sentiment classification model.
在此步骤中,我们将评论分为“正面”和“负面”,因此我们可以将其用作情感分类模型的训练数据。
Positive reviews will be classified as +1, and negative reviews will be classified as -1.
正面评论将被分类为+1,负面评论将被分类为-1。
We will classify all reviews with ‘Score’ > 3 as +1, indicating that they are positive.
我们会将所有“得分”> 3的评论归为+1,表示它们是肯定的。
All reviews with ‘Score’ < 3 will be classified as -1. Reviews with ‘Score’ = 3 will be dropped, because they are neutral. Our model will only classify positive and negative reviews.
“分数” <3的所有评论将被分类为-1。 “分数” = 3的评论将被删除,因为它们是中立的。 我们的模型只会对正面和负面评论进行分类。
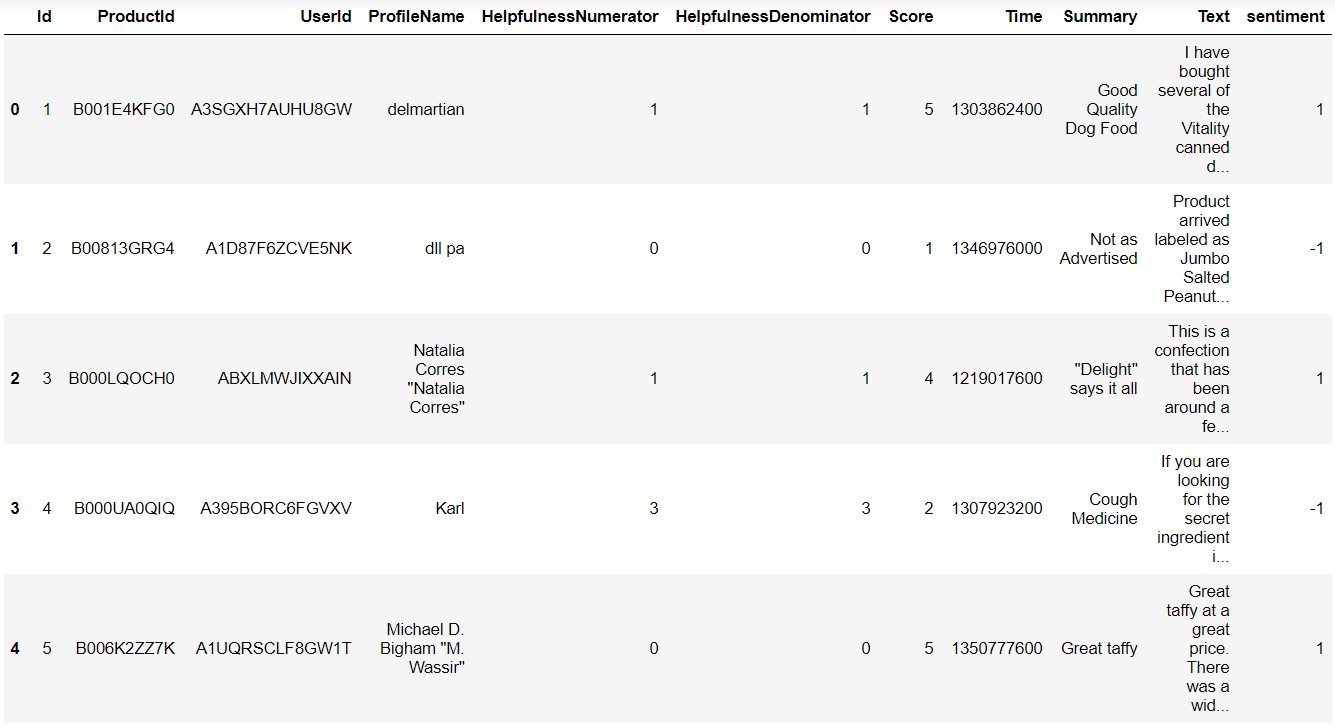
# assign reviews with score > 3 as positive sentiment
# score < 3 negative sentiment
# remove score = 3df = df[df['Score'] != 3]
df['sentiment'] = df['Score'].apply(lambda rating : +1 if rating > 3 else -1)
Looking at the head of the data frame now, we can see a new column called ‘sentiment:’
现在看一下数据框的开头,我们可以看到一个新列,名为“ sentiment:”。
步骤4:更多资料分析 (Step 4: More Data Analysis)
Now that we have classified tweets into positive and negative, let’s build wordclouds for each!
现在,我们已将推文分为正面和负面两类,让我们为每个构建词云!
First, we will create two data frames — one with all the positive reviews, and another with all the negative reviews.
首先,我们将创建两个数据框架-一个包含所有正面评价的数据框,另一个包含所有负面评价的数据框。
# split df - positive and negative sentiment:positive = df[df['sentiment'] == 1]
negative = df[df['sentiment'] == -1]
Wordcloud — Positive Sentiment
Wordcloud —积极情绪
stopwords = set(STOPWORDS)
stopwords.update(["br", "href","good","great"]) ## good and great removed because they were included in negative sentimentpos = " ".join(review for review in positive.Summary)
wordcloud2 = WordCloud(stopwords=stopwords).generate(pos)plt.imshow(wordcloud2, interpolation='bilinear')
plt.axis("off")
plt.show()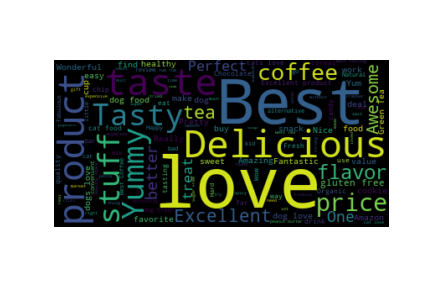
Wordcloud — Negative Sentiment
Wordcloud —负面情绪
neg = " ".join(review for review in negative.Summary)
wordcloud3 = WordCloud(stopwords=stopwords).generate(neg)plt.imshow(wordcloud3, interpolation='bilinear')
plt.axis("off")
plt.savefig('wordcloud33.png')
plt.show()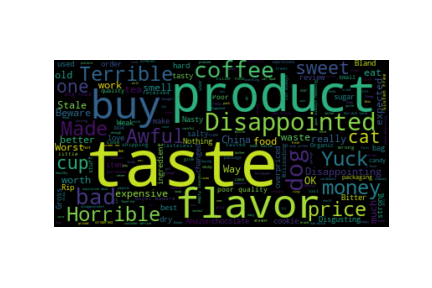
As seen above, the positive sentiment word cloud was full of positive words, such as “love,” “best,” and “delicious.”
如上所示,积极情绪词云充满了积极词,例如“ 爱 ”,“ 最好 ”和“ 美味” 。 ”
The negative sentiment word cloud was filled with mostly negative words, such as “disappointed,” and “yuck.”
负面情绪词云中弥漫着大多是负面的词,如“ 失望 ”和“ 呸 。 ”
The words “good” and “great” initially appeared in the negative sentiment word cloud, despite being positive words. This is probably because they were used in a negative context, such as “not good.” Due to this, I removed those two words from the word cloud.
词语“ 好 ”和“ 大 ”最初出现在负面情绪词云,尽管是积极的话。 这可能是因为它们是在负面环境中使用的,例如“ 不好” 。 因此,我从词云中删除了这两个词。
Finaly, we can take a look at the distribution of reviews with sentiment across the dataset:
最后,我们可以看一下在数据集中带有情感的评论的分布情况:
df['sentimentt'] = df['sentiment'].replace({-1 : 'negative'})
df['sentimentt'] = df['sentimentt'].replace({1 : 'positive'})
fig = px.histogram(df, x="sentimentt")
fig.update_traces(marker_color="indianred",marker_line_color='rgb(8,48,107)',
                  marker_line_width=1.5)
fig.update_layout(title_text='Product Sentiment')
fig.show()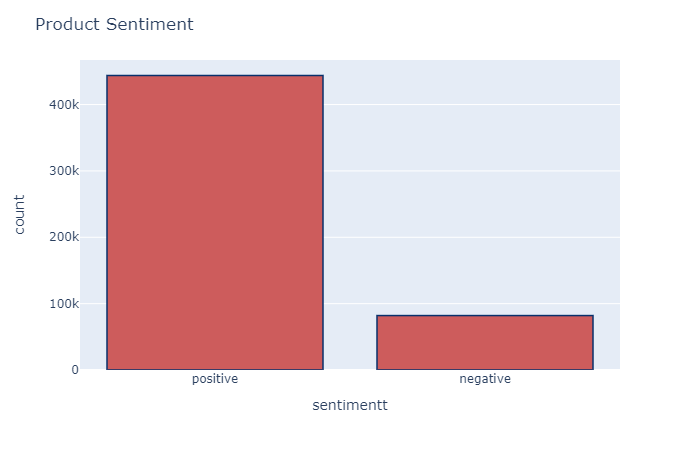
步骤5:建立模型 (Step 5: Building the Model)
Finally, we can build the sentiment analysis model!
最后,我们可以建立情感分析模型!
This model will take reviews in as input. It will then come up with a prediction on whether the review is positive or negative.
该模型将接受评论作为输入。 然后,它将对审查是正面还是负面做出预测。
This is a classification task, so we will train a simple logistic regression model to do it.
这是一个分类任务,因此我们将训练一个简单的逻辑回归模型来完成此任务。
For reference, take a look at the data frame again:
作为参考,请再次查看数据框:

There are a few steps we need to take:
我们需要采取一些步骤:
Data Cleaning
数据清理
We will be using the summary data to come up with predictions. First, we need to remove all punctuation from the data.
我们将使用汇总数据得出预测。 首先,我们需要从数据中删除所有标点符号。
def remove_punctuation(text):
    final = "".join(u for u in text if u not in ("?", ".", ";", ":",  "!",'"'))
    return finaldf['Text'] = df['Text'].apply(remove_punctuation)
df = df.dropna(subset=['Summary'])
df['Summary'] = df['Summary'].apply(remove_punctuation)
Split the Dataframe
分割数据框
The new data frame should only have two columns — “Summary” (the review text data), and “sentiment” (the target variable).
新数据框应只有两列-“ 摘要 ”(审阅文本数据)和“ 观点 ”(目标变量)。
dfNew = df[['Summary','sentiment']]
dfNew.head()
Taking a look at the head of the new data frame, this is the data it will now contain:
看一下新数据框的开头,这是它现在将包含的数据:

We will now split the data frame into train and test sets. 80% of the data will be used for training, and 20% will be used for testing.
现在,我们将数据框架分为训练集和测试集。 80%的数据将用于培训,而20%的数据将用于测试。
# random split train and test dataindex = df.index
df['random_number'] = np.random.randn(len(index))train = df[df['random_number'] <= 0.8]
test = df[df['random_number'] > 0.8]
Create a bag of words
创建一个词袋
Next, we will use a count vectorizer from the Scikit-learn library.
接下来,我们将使用Scikit-learn库中的计数矢量化器。
This will transform the text in our data frame into a bag of words model, which will contain a sparse matrix of integers. The number of occurrences of each word will be counted and printed.
这会将数据框中的文本转换成单词袋模型,其中将包含一个稀疏的整数矩阵。 每个单词的出现次数将被计数并打印出来。
We will need to convert the text into a bag-of-words model since the logistic regression algorithm cannot understand text.
由于逻辑回归算法无法理解文本,因此我们需要将文本转换成词袋模型。
# count vectorizer:from sklearn.feature_extraction.text import CountVectorizervectorizer = CountVectorizer(token_pattern=r'\b\w+\b')train_matrix = vectorizer.fit_transform(train['Summary'])
test_matrix = vectorizer.transform(test['Summary'])
Import Logistic Regression
导入Logistic回归
# Logistic Regressionfrom sklearn.linear_model import LogisticRegression
lr = LogisticRegression()
Split target and independent variables
分割目标变量和自变量
X_train = train_matrix
X_test = test_matrix
y_train = train['sentiment']
y_test = test['sentiment']
Fit model on data
在数据上拟合模型
lr.fit(X_train,y_train)Make predictions
作出预测
predictions = lr.predict(X_test)We have successfully built a simple logistic regression model, and trained the data on it. We also made predictions using the model.
我们已经成功建立了一个简单的逻辑回归模型,并对其进行了训练。 我们还使用该模型进行了预测。
步骤6:测试 (Step 6: Testing)
Now, we can test the accuracy of our model!
现在,我们可以测试模型的准确性了!
# find accuracy, precision, recall:from sklearn.metrics import confusion_matrix,classification_report
new = np.asarray(y_test)
confusion_matrix(predictions,y_test)
You will get a confusion matrix that looks like this:
您将获得一个混乱矩阵,如下所示:

print(classification_report(predictions,y_test))The classification report:
分类报告:

The overall accuracy of the model on the test data is around 93%, which is pretty good considering we didn’t do any feature extraction or much preprocessing.
该模型在测试数据上的总体准确性约为93%,考虑到我们没有进行任何特征提取或大量预处理,因此这是相当不错的。
And… That’s it!
而且...就是这样!
I hope you learnt something useful from this tutorial. A good exercise for you to try out after this would be to include all three sentiments in your classification task — positive,negative, and neutral.
我希望您从本教程中学到了有用的东西。 在此之后尝试进行尝试的一个好方法是将所有三个情感都包括在分类任务中,包括积极,消极和中立。
Thanks for reading, and remember — Never stop learning!
感谢您的阅读和记住- 永不停止学习!
The world is a university and everyone in it is a teacher. Make sure when you wake up in the morning, you go to school.
世界是一所大学,其中的每个人都是老师。 确保早上起床时去上学。
翻译自: https://towardsdatascience.com/a-beginners-guide-to-sentiment-analysis-in-python-95e354ea84f6
python编程初学者指南


 301
301

 被折叠的 条评论
为什么被折叠?
被折叠的 条评论
为什么被折叠?
 到【灌水乐园】发言


