


整合自网络与https://space.bilibili.com/243821484?from=search&seid=8124768530697300938
2.numpy
2.1 平均值
使用np.mean()函数,numpy.mean(a, axis, dtype)
假设a为[time,lat,lon]的数据,那么
·axis 不设置值,对 timelatlon 个值求均值,返回一个数
·axis = 0:压缩时间维,对每一个经纬点求均值,返回 [lat, lon] 数组(如求一个场的N年气候态)
·axis =1,2 :压经度纬度,对每个时间求平均值,返回 [time] 矩阵(如求某时间序列,或指数)
需要特别注意的是,气象数据中常有缺测,在NCL中,使用求均值函数会自动略过,而在python中,当任意一数与缺测(np.nan)计算的结果均为np.nan,比如求[1,2,3,4,np.nan]的平均值,结果为np.nan
因此,当数据存在缺测数据时,通常使用np.nanmean()函数,用法同上,此时[1,2,3,4,np.nan]的平均值为(1+2+3+4)/4 = 2.5
同样的,求某数组最大最小值时也有np.nanmax(), np.nanmin()函数来补充np.max(), np.min()的不足。
其他很多np的计算函数也可以通过在前边加‘nan’来使用。
2.2 增减维数
增加
在操作数组情况下,需要按照某个轴将不同数组的维度对齐,这时候需要为数组添加维度(特别是将二维数组变成高维张量的情况下)。numpy提供了expand_dims()函数来为数组增加维度:
1 importnumpy as np2
3 a = np.array([[1,2],[3,4]])4 a.shape5 print(a)6 >>>
7 """
8 (2L, 2L)9 [[1 2]10 [3 4]]11 """
12 #如果需要在数组上增加维度,输入需要增添维度的轴即可,注意index从零还是
13 a_add_dimension = np.expand_dims(a,axis=0)14 a_add_dimension.shape15 >>> (1L, 2L, 2L)16
17 a_add_dimension2 = np.expand_dims(a,axis=-1)18 a_add_dimension2.shape19 >>> (2L, 2L, 1L)20
21
22 a_add_dimension3 = np.expand_dims(a,axis=1)23 a_add_dimension3.shape24 >>> (2L, 1L, 2L)
减少
在数组中会存在很多轴只有1维的情况,可以使用squeeze函数来压缩冗余维度
reshape函数:
1 e= np.arange(10)2 e3 array([0, 1, 2, 3, 4, 5, 6, 7, 8, 9])
1 e.reshape(1,1,10)2 array([[[0, 1, 2, 3, 4, 5, 6, 7, 8, 9]]])
1 e.reshape(1,1,10)2 array([[[0, 1, 2, 3, 4, 5, 6, 7, 8, 9]]])3 e.reshape(1,10,1)4 array([[[0],5 [1],6 [2],7 [3],8 [4],9 [5],10 [6],11 [7],12 [8],13 [9]]])
squeeze 函数:从数组的形状中删除单维度条目,即把shape中为1的维度去掉
用法:numpy.squeeze(a,axis = None)
a表示输入的数组;
axis用于指定需要删除的维度,但是指定的维度必须为单维度,否则将会报错;
axis的取值可为None 或 int 或 tuple of ints, 可选。若axis为空,则删除所有单维度的条目;
返回值:数组
不会修改原数组;
1 a = e.reshape(1,1,10)2 a3 array([[[0, 1, 2, 3, 4, 5, 6, 7, 8, 9]]])4 np.squeeze(a)5 array([0, 1, 2, 3, 4, 5, 6, 7, 8, 9])
3.Pandas
如果用 python 的列表和字典来作比较, 那么可以说 Numpy 是列表形式的,没有数值标签,而 Pandas 就是字典形式
1 importpandas as pd2 importnumpy as np3 s = pd.Series([1,3,6,np.nan,44,1])
5 print(s)
###################
0 1.0
1 3.0
2 6.0
3NaN4 44.0
5 1.0dtype: float64###################
Series的字符串表现形式为:索引在左边,值在右边。由于我们没有为数据指定索引。
3.1DataFrame
1 dates = pd.date_range('20160101',periods=6)2 print(dates)3 df = pd.DataFrame(np.random.randn(6,4),index=dates,columns=['a','b','c','d']) #行 列
5 print(df)
#############################################################################
DatetimeIndex(['2016-01-01', '2016-01-02', '2016-01-03', '2016-01-04','2016-01-05', '2016-01-06'],
dtype='datetime64[ns]', freq='D')
a b c d2016-01-01 -0.362729 0.025856 -0.453970 0.521317
2016-01-02 -0.694964 -0.418078 -0.034875 -0.382649
2016-01-03 -1.308891 -0.465486 -0.892237 -0.094203
2016-01-04 0.331540 0.621307 0.033407 -1.490113
2016-01-05 -1.770037 1.443139 -0.465179 -1.571931
2016-01-06 0.017418 -0.007310 1.151194 -0.043637
#############################################################################
DataFrame是一个表格型的数据结构,它包含有一组有序的列,每列可以是不同的值类型(数值,字符串,布尔值等)。DataFrame既有行索引也有列索引, 它可以被看做由Series组成的大字典。
选择显示pd其中一行
1 print(df['b'])
########################
2016-01-01 0.743081
2016-01-02 -0.558816
2016-01-03 0.287229
2016-01-04 1.850405
2016-01-05 0.619291
2016-01-06 0.847188Freq: D, Name: b, dtype: float64########################
不选择显示列索引,默认从零开始
1 df1 = pd.DataFrame(np.arange(12).reshape((3,4)))2 print(df1)
##########
0 1 2 30 01 2 3
1 4 5 6 7
2 8 9 10 11
##########
显示列的序号、数据的名称、所有的值
1 df2 = pd.DataFrame({'A' : 1.,2 'B' : pd.Timestamp('20130102'),3 'C' : pd.Series(1,index=list(range(4)),dtype='float32'),4 'D' : np.array([3] * 4,dtype='int32'),5 'E' : pd.Categorical(["test","train","test","train"]),6 'F' : 'foo'})7
8 print(df2)
"""A B C D E F
0 1.0 2013-01-02 1.0 3 test foo
1 1.0 2013-01-02 1.0 3 train foo
2 1.0 2013-01-02 1.0 3 test foo
3 1.0 2013-01-02 1.0 3 train foo"""
1 print(df2.index)
"""
Int64Index([0, 1, 2, 3], dtype='int64')
"""
1 print(df2.columns)
"""Index(['A', 'B', 'C', 'D', 'E', 'F'], dtype='object')"""
1 print(df2.values)
"""array([[1.0, Timestamp('2013-01-02 00:00:00'), 1.0, 3, 'test', 'foo'],
[1.0, Timestamp('2013-01-02 00:00:00'), 1.0, 3, 'train', 'foo'],
[1.0, Timestamp('2013-01-02 00:00:00'), 1.0, 3, 'test', 'foo'],
[1.0, Timestamp('2013-01-02 00:00:00'), 1.0, 3, 'train', 'foo']], dtype=object)"""
显示行索引信息
1 print(df2.dtypes)
"""df2.dtypes
A float64
B datetime64[ns]
C float32
D int32
E category
F object
dtype: object"""
数据的总结。只针对数值类型
1 df2.describe()
A C D
count4.0 4.0 4.0mean1.0 1.0 3.0std0.0 0.0 0.0min1.0 1.0 3.0
25% 1.0 1.0 3.0
50% 1.0 1.0 3.0
75% 1.0 1.0 3.0max1.0 1.0 3.0
翻转数据
1 print(df2.T)
0 1 2\
A1 1 1B2013-01-02 00:00:00 2013-01-02 00:00:00 2013-01-02 00:00:00C1 1 1D3 3 3E test train test
F foo foo foo3A1B2013-01-02 00:00:00C1D3E train
F foo
对数据的 index 进行排序并输出
1 print(df2.sort_index(axis=0, ascending=True)) #axis=0为选择列索引,axis=1为选择行索引
2 print(df2.sort_index(axis=1, ascending=False)) #ascending=True为正序,False为倒序
A B C D E F
01.0 2013-01-02 1.0 3test foo1 1.0 2013-01-02 1.0 3train foo2 1.0 2013-01-02 1.0 3test foo3 1.0 2013-01-02 1.0 3train foo
F E D C B A
0 foo test3 1.0 2013-01-02 1.0
1 foo train 3 1.0 2013-01-02 1.0
2 foo test 3 1.0 2013-01-02 1.0
3 foo train 3 1.0 2013-01-02 1.0
对数据 值 某一列 排序输出:
1 print(df2.sort_values(by='E'))
A B C D E F
01.0 2013-01-02 1.0 3test foo2 1.0 2013-01-02 1.0 3test foo1 1.0 2013-01-02 1.0 3train foo3 1.0 2013-01-02 1.0 3 train foo
3.2 选择数据
1 dates = pd.date_range('20130101', periods=6)2 df = pd.DataFrame(np.arange(24).reshape((6,4)),index=dates, columns=['A','B','C','D'])3 df
"""A B C D
2013-01-01 0 1 2 3
2013-01-02 4 5 6 7
2013-01-03 8 9 10 11
2013-01-04 12 13 14 15
2013-01-05 16 17 18 19
2013-01-06 20 21 22 23"""
选择某一列
1 print(df['A'])2 或者3 print(df.A)
"""
2013-01-0102013-01-02 4
2013-01-03 8
2013-01-04 12
2013-01-05 16
2013-01-06 20
"""
选择跨越多行或多列
1 print(df[0:3])
"""A B C D
2013-01-01 0 1 2 3
2013-01-02 4 5 6 7
2013-01-03 8 9 10 11"""
1 print(df[0:3]["A"])
"""
2013-01-01 0
2013-01-02 4
2013-01-03 8
"""
1 print(df['20130102':'20130104'])
"""A B C D
2013-01-02 4 5 6 7
2013-01-03 8 9 10 11
2013-01-04 12 13 14 15"""
loc使用标签来选择数据
1 print(df.loc['20130102'])
"""A 4
B 5
C 6
D 7
Name: 2013-01-02 00:00:00, dtype: int64"""
1 print(df.loc[:,['A','B']])
1 """
2 A B3 2013-01-01 0 14 2013-01-02 4 55 2013-01-03 8 96 2013-01-04 12 137 2013-01-05 16 178 2013-01-06 20 219 """
1 print(df.loc['20130102',['A','B']])
"""A 4
B 5
Name: 2013-01-02 00:00:00, dtype: int64"""
iloc根据序列来选择数据
1 print(df)
2 print(df.iloc[3,1]) #第4行第2列
'''A B C D
2013-01-01 0 1 2 3
2013-01-02 4 5 6 7
2013-01-03 8 9 10 11
2013-01-04 12 13 14 15
2013-01-05 16 17 18 19
2013-01-06 20 21 22 23
13'''
1 print(df.iloc[3:5,1:3]) #第三行到第五行,第一列到第三列
"""B C
2013-01-04 13 14
2013-01-05 17 18"""
1 print(df.iloc[[1,3,5],1:3])
"""B C
2013-01-02 5 6
2013-01-04 13 14
2013-01-06 21 22"""
通过判断的筛选
1 print(df[df.A>8])
"""A B C D
2013-01-04 12 13 14 15
2013-01-05 16 17 18 19
2013-01-06 20 21 22 23"""
当有条件筛选时,如下图筛选出所有C列PM2.5在I列1006A处的值:
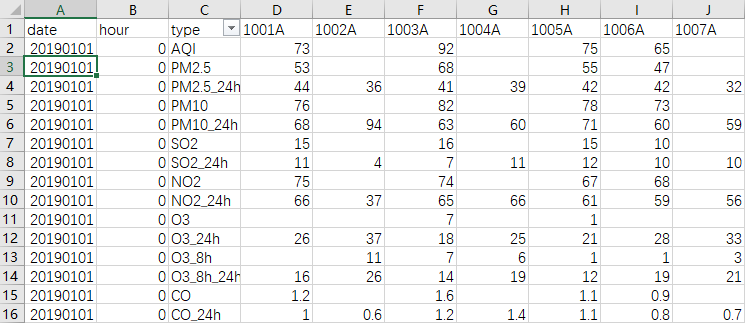
1 path = 'D:\python\站点_20190101-20191231\china_sites_20190101.csv'
2 csv_data =pd.read_csv(path)3 aa=csv_data[csv_data['type'] == 'PM2.5'][['type', '1006A']]4 aa
######
1006A1 47.0
16 44.0
31 43.0
46 40.0
61 42.0
76 46.0
91 47.0
106 49.0
121 47.0
136 53.0
151 46.0
166 34.0。。。。。。#######
3.2 编辑、写入值
1 #创建数据
2 dates = pd.date_range('20130101', periods=6)3 df = pd.DataFrame(np.arange(24).reshape((6,4)),index=dates, columns=['A','B','C','D'])
"""A B C D
2013-01-01 0 1 2 3
2013-01-02 4 5 6 7
2013-01-03 8 9 10 11
2013-01-04 12 13 14 15
2013-01-05 16 17 18 19
2013-01-06 20 21 22 23"""
根据位置用loc 和 iloc设置
1 df.iloc[2,2] = 1111
2 df.loc['20130101','B'] = 2222
"""A B C D
2013-01-01 0 2222 2 3
2013-01-02 4 5 6 7
2013-01-03 8 9 1111 11
2013-01-04 12 13 14 15
2013-01-05 16 17 18 19
2013-01-06 20 21 22 23"""
根据条件设置
1 df.B[df.A>4] = 0 #A列>4时,B列数据等于0
"""A B C D
2013-01-01 0 2222 2 3
2013-01-02 4 5 6 7
2013-01-03 8 0 1111 11
2013-01-04 12 0 14 15
2013-01-05 16 0 18 19
2013-01-06 20 0 22 23"""
按行或列设置
1 df['F'] = np.nan
"""A B C D F
2013-01-01 0 2222 2 3 NaN
2013-01-02 4 5 6 7 NaN
2013-01-03 8 0 1111 11 NaN
2013-01-04 12 0 14 15 NaN
2013-01-05 16 0 18 19 NaN
2013-01-06 20 0 22 23 NaN"""
生成日期
1 date_l=[datetime.strftime(x,'%Y%m%d') for x in list(pd.date_range(start="20190101", end="20190131"))]
#'%Y%m%d'可以改变生成日期格式,如%Y-%m-%d,
['20190101','20190102','20190103','20190104','20190105','20190106','20190107','20190108','20190109','20190110','20190111','20190112','20190113','20190114','20190115','20190116','20190117','20190118','20190119','20190120','20190121','20190122','20190123','20190124','20190125','20190126','20190127','20190128','20190129','20190130','20190131']
处理nan
1.直接删除,将含有NaN的列(columns)去掉:
1 importpandas as pd2
3 df = pd.DataFrame({'a':[None,1,2,3],'b':[4,None,None,6],'c':[1,2,1,2],'d':[7,7,9,2]})4 print(df)5
6 print(df.isnull().sum())7 #查找有多少nan
a b c d
0 NaN4.0 1 7
1 1.0 NaN 2 7
2 2.0 NaN 1 9
3 3.0 6.0 2 2a1b2c 0
d 0
dtype: int64
1 data_without_NaN =df.dropna(axis=1)2 print (data_without_NaN)
c d
01 7
1 2 7
2 1 9
3 2 2
2.遗失值插补法
以均值填补
1 from sklearn.preprocessing importImputer2 #或者from sklearn.impute import SimpleImputer
3 my_imputer =Imputer()4 data_imputed =my_imputer.fit_transform(df)5 print(type(data_imputed))6 #array转换成df
7 df_data_imputed = pd.DataFrame(data_imputed,columns=df.columns)8 print (df_data_imputed)
a b c d
02.0 4.0 1.0 7.0
1 1.0 5.0 2.0 7.0
2 2.0 5.0 1.0 9.0
3 3.0 6.0 2.0 2.0


 1416
1416


 被折叠的 条评论
为什么被折叠?
被折叠的 条评论
为什么被折叠?
 到【灌水乐园】发言


