


代码:function drawPointsToMap(id, name, x, y, leixing, value, date) {
//开始画,画成能够在页面上显示数字的形式。
var point = new esri.geometry.Point(x, y);
var textSymbol = new esri.symbol.TextSymbol(value,font1,color1);
var sms = new esri.symbol.PictureMarkerSymbol("Content/Default_Index/themes/icons/blue_foot.png", 45, 20);
sms.setOffset(1, 5);
var infoTemplate = new esri.InfoTemplate();
infoTemplate.setTitle("
infoTemplate.setContent("id:" + id + "
名称:" + name + "
数据:" + value + "
时间:" + date + "
类型:" + leixing);
var simpleMarkerSymbol = new esri.symbol.SimpleMarkerSymbol();
var graphic = new esri.Graphic(point, textSymbol);
var graphic1 = new esri.Graphic(point, sms);
graphicslayer.add(graphic1);
graphicslayer.add(graphic.setInfoTemplate(infoTemplate));
}
分析:
代码中的id、name、value、date、leixing是需要在infoWindow(infoTemplate)中显示的内容。
x、y是点的坐标
textSymbol是要显示在地图上的内容value
font1和color1 是被写在map主函数中的全局变量。
定义全局变量:
var font1;//这个是字体
var color1;//这个是颜色
require中:
"esri/Color",
"esri/symbols/Font",
function 的小括号中:
Color,
Font,
function 的大括号的开头:
font1 = new Font("13px", Font.STYLE_NORMAL, Font.VARIANT_NORMAL, Font.WEIGHT_BOLDER);
color1 = new Color([255, 255, 0]);
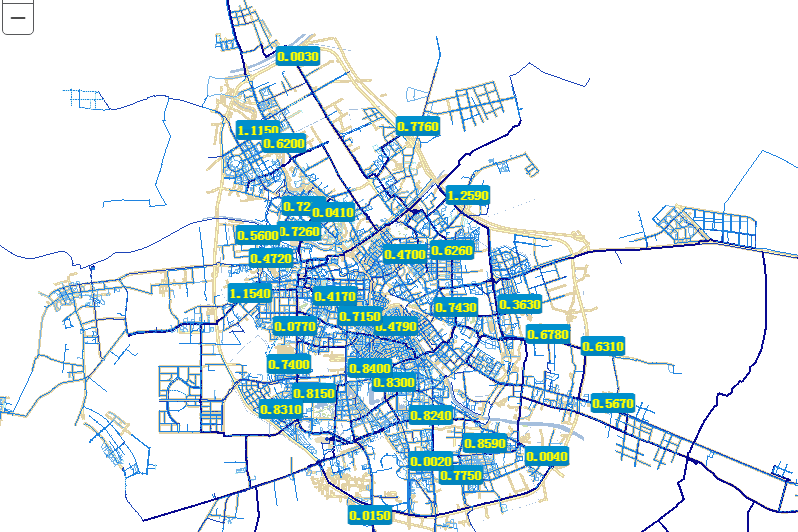
效果图:


 1724
1724


 被折叠的 条评论
为什么被折叠?
被折叠的 条评论
为什么被折叠?
 到【灌水乐园】发言


