


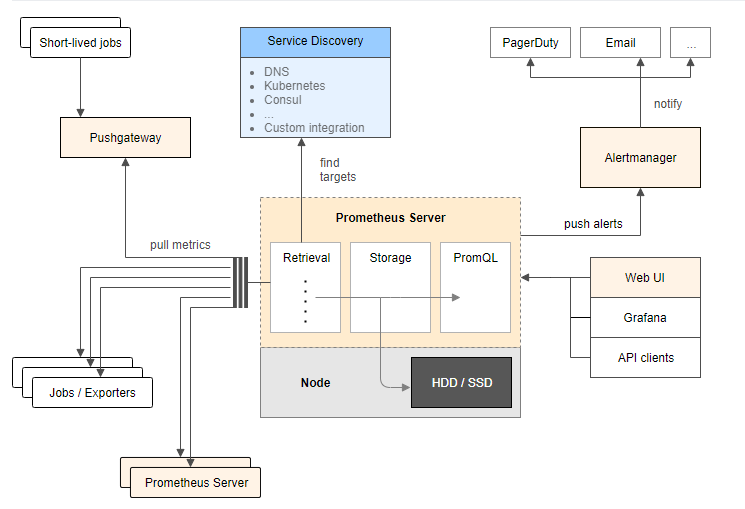
架构图
环境
ip
环境
需装软件
192.168.0.237
mysql-5.7.20
node_exporter-0.15.2.linux-amd64.tar.gz
mysqld_exporter-0.10.0.linux-amd64.tar.gz
192.168.0.248
grafana+prometheus
prometheus-2.1.0.linux-amd64.tar.gz
node_exporter-0.15.2.linux-amd64.tar.gz
grafana-4.6.3.linux-x64.tar.gz
在 192.168.0.248 上安装 grafana prometheus
安装 prometheus
# 创建保存软件的目录
mkdir /data/software/ -p
cd /data/software/
# 解压 prometheus
tar xvf prometheus-2.1.0.linux-amd64.tar.gz -c /iba/
cd /iba/
mv prometheus-2.1.0.linux-amd64 prometheus
cd prometheus/
cp prometheus.yml /tmp/prometheus.yml.20181203
# 配置 prometheus.yml
cat prometheus.yml
# my global config
global:
scrape_interval: 15s # set the scrape interval to every 15 seconds. default is every 1 minute.
evaluation_interval: 15s # evaluate rules every 15 seconds. the default is every 1 minute.
# scrape_timeout is set to the global default (10s).
# a scrape configuration containing exactly one endpoint to scrape:
# here it's prometheus itself.
scrape_configs:
- job_name: 'host'
file_sd_configs:
- files:
- host.yml
metrics_path: /metrics
relabel_configs:
- source_labels: [__address__]
regex: (.*)
target_label: instance
replacement: $1
- source_labels: [__address__]
regex: (.*)
target_label: __address__
replacement: $1:9100
- job_name: 'mysql'
file_sd_configs:
- files:
- mysql.yml
metrics_path: /metrics
relabel_configs:
- source_labels: [__address__]
regex: (.*)
target_label: instance
replacement: $1
- source_labels: [__address__]
regex: (.*)
target_label: __address__
replacement: $1:9104
- job_name: 'prometheus'
static_configs:
- targets:
- localhost:9090
cat host.yml
- labels:
service: test
targets:
- 192.168.0.248
- 192.168.0.237
cat mysql.yml
- labels:
service: test
targets:
- 192.168.0.237
# 测试 prometheus 是否可以正常启动
/iba/prometheus/prometheus --storage.tsdb.retention=30d &
ps -ef|grep prometh
kill -9 14650
# 配置 prometheus.service 文件
vi /usr/lib/systemd/system/prometheus.service
# 内容为
[unit]
description=prometheus instance
wants=network-online.target
after=network-online.target
[service]
user=root
group=root
type=simple
restart=on-failure
workingdirectory=/iba/prometheus/
runtimedirectory=prometheus
runtimedirectorymode=0750
execstart=/iba/prometheus/prometheus --storage.tsdb.retention=30d --config.file=/iba/prometheus/prometheus.yml
limitnofile=10000
timeoutstopsec=20
[install]
wantedby=multi-user.target
# 启动 prometheus
systemctl start prometheus
systemctl status prometheus -l
# 开放防火墙
firewall-cmd --permanent --add-rich-rule="rule family="ipv4" source address="192.168.0.0/16" accept"
firewall-cmd --reload
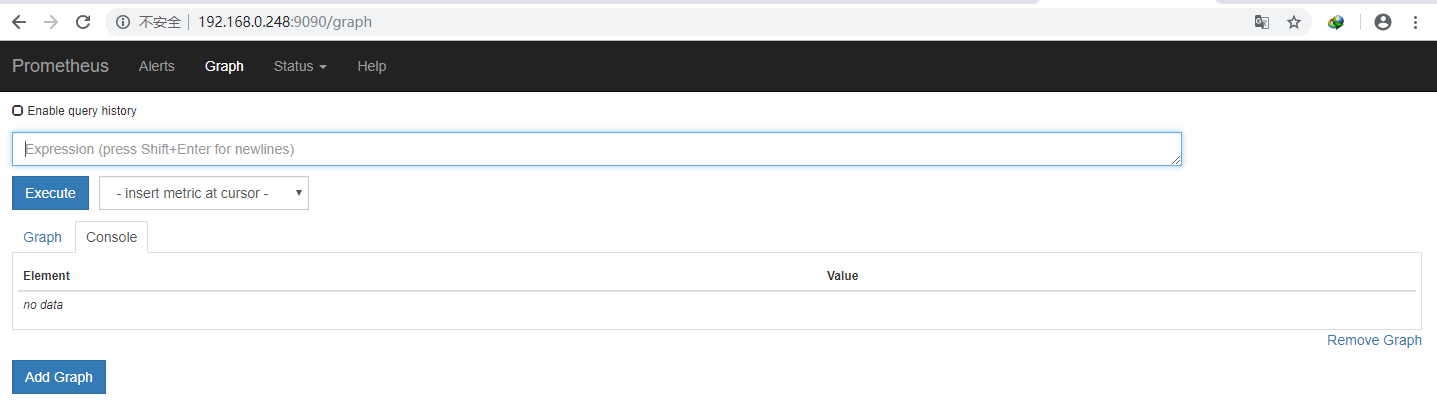
浏览器输入 http://192.168.0.248:9090 访问
prometheus.yml 文件参考:
https://prometheus.io/docs/prometheus/latest/configuration/configuration/
https://prometheus.io/docs/prometheus/latest/configuration/configuration/#%3crelabel_config%3e
https://prometheus.io/docs/prometheus/latest/configuration/configuration/#%3cfile_sd_config%3e
安装 node_exporter 获取主机信息
# 解压 node_exporter
cd /data/software/
tar xf node_exporter-0.15.2.linux-amd64.tar.gz -c /usr/local
mv node_exporter-0.15.2.linux-amd64 node_exporter
nohup ./node_exporter &
安装 grafana
cd /iba/software
# 解压
tar xf grafana-4.6.3.linux-x64.tar.gz -c /iba/prometheus/
cd /iba/prometheus/
mv grafana-4.6.3 grafana
cd grafana/
# 测试
./bin/grafana-server
# 停止
ctrl+c
cat /usr/lib/systemd/system/grafana-server.service
[unit]
description=grafana instance
documentation=http://docs.grafana.org
wants=network-online.target
after=network-online.target
[service]
user=root
group=root
type=simple
restart=on-failure
workingdirectory=/iba/prometheus/grafana
runtimedirectory=grafana
runtimedirectorymode=0750
execstart=/iba/prometheus/grafana/bin/grafana-server
limitnofile=10000
timeoutstopsec=20
[install]
wantedby=multi-user.target
# 启动
systemctl start grafana-server
systemctl status grafana-server -l
访问 http://192.168.0.248:3000,默认用户和密码是 admin/admin

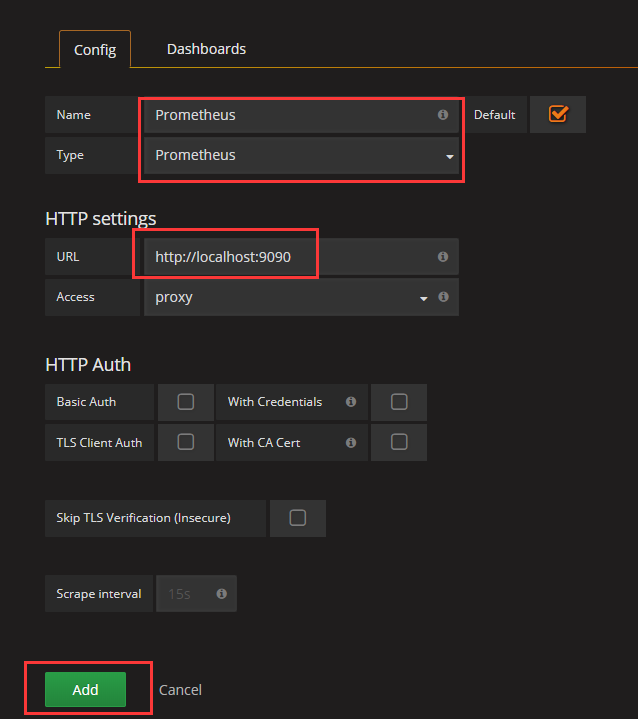
配置数据源

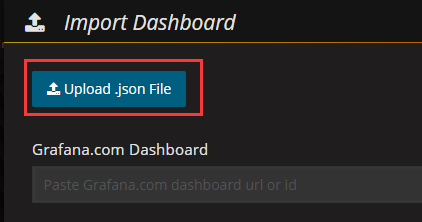
下载 grafana-dashboards-1.6.1.tar.gz,解压,使用浏览器导入 dashboard, 下载地址:https://github.com/percona/grafana-dashboards/archive/v1.6.1.tar.gz


在 192.168.0.237 安装 node_exporter 和 mysqld_exporter
cd /iba/software/
tar zxf node_exporter-0.15.2.linux-amd64.tar.gz -c /usr/local/
cd /usr/local/
mv node_exporter-0.15.2.linux-amd64 node_exporter
# 启动
cd node_exporter/
nohup ./node_exporter &
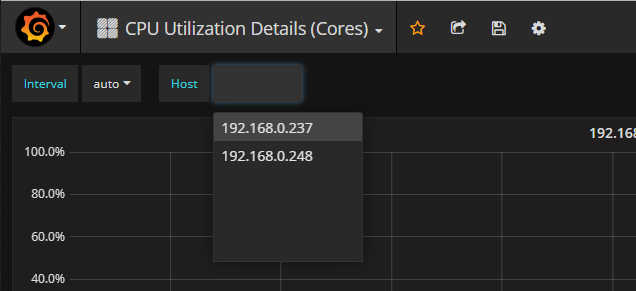
几分钟后 grafana 出现了新服务器的信息
在mysql上配置监控使用的用户
grant replication client, process, select on *.* to 'mysql_monitor'@'%' identified by 'mysql_monitor';
flush privileges;
cd /iba/software/
tar zxf mysqld_exporter-0.10.0.linux-amd64.tar.gz -c /usr/local/
cd /usr/local/
mv mysqld_exporter-0.10.0.linux-amd64/ mysqld_exporter
cd mysqld_exporter/
# 在 mysql 上创建一个专门用于监控的用户,
cat .my.cnf
[client]
user=mysql_monitor
password=mysql_monitor
# 启动
nohup /usr/local/mysqld_exporter/mysqld_exporter -config.my-cnf="/usr/local/mysqld_exporter/.my.cnf" &
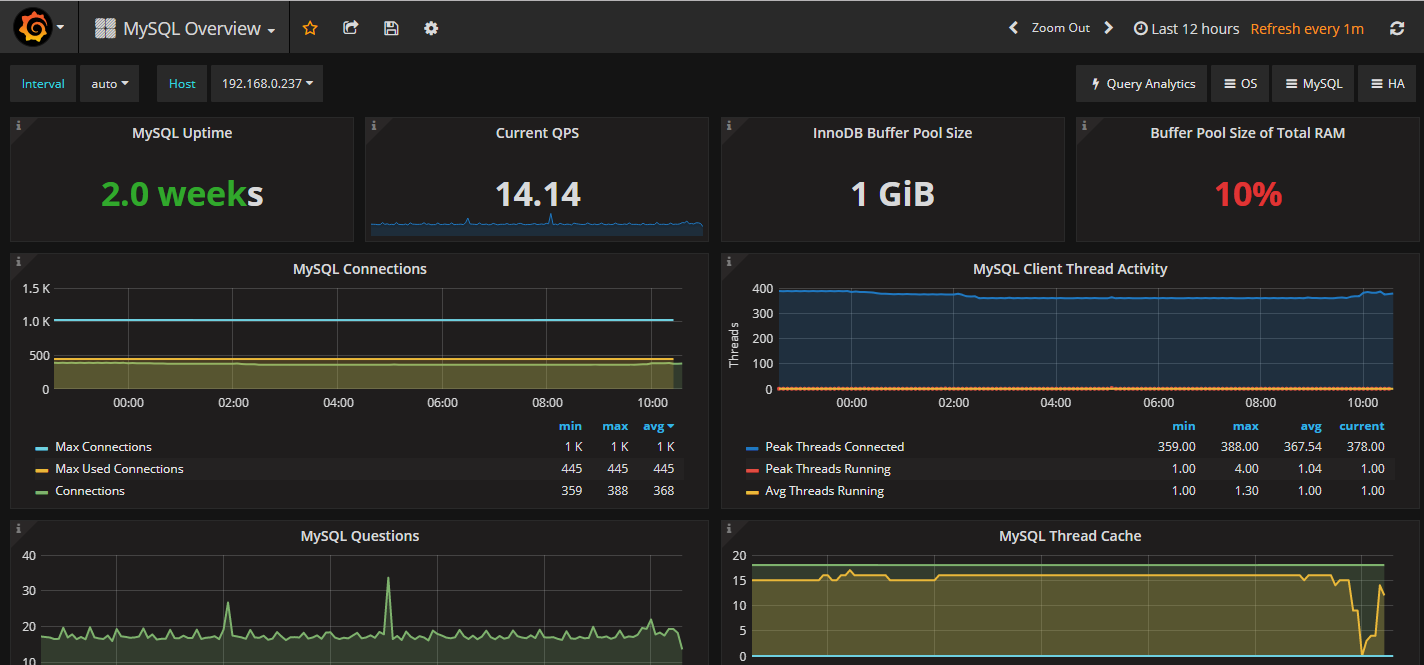
导入 dashboard: mysql_overview.json
如您对本文有疑问或者有任何想说的,请点击进行留言回复,万千网友为您解惑!


 990
990


 被折叠的 条评论
为什么被折叠?
被折叠的 条评论
为什么被折叠?
 到【灌水乐园】发言


