


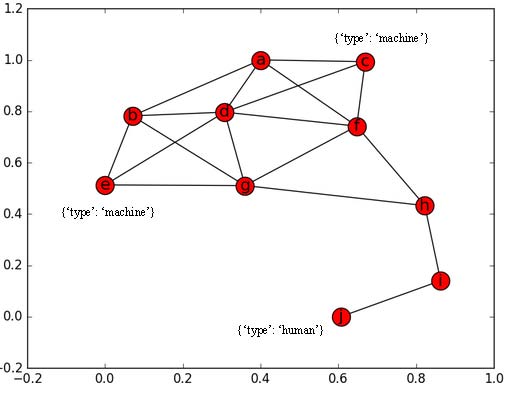
I am working on a small example node set belonging to two types {'human', 'machine'} and I want to label node attributes in dictionary form outside of each node in networkx graph, such as those shown in nodes c, e, j in the graph below. (I used MS Word to add dictionary-type attributes on the graph.):
The base plot is generated using the following code:
import networkx as nx
G = nx.Graph()
G.add_nodes_from(['a', 'b', 'c', 'd', 'e', 'f', 'g'], type = 'machine')
G.add_nodes_from(['h', 'i', 'j'], type = 'human')
G.add_edges_from([('a', 'c'), ('a', 'b'), ('a', 'd'), ('a', 'f'), ('b', 'd'), ('b', 'e'), ('b', 'g'), ('c', 'f'), ('c', 'd'), ('d', 'f'), ('d', 'e'), ('d', 'g'), ('e', 'g'), ('f', 'g'), ('f', 'h'), ('g', 'h'), ('h', 'i'), ('i', 'j')])
def plot_graph(G, weight_name=None):
import matplotlib.pyplot as plt
plt.figure()
pos = nx.spring_layout(G)
edges = G.edges()
weights = None
if weight_name:
weights = [int(G[u][v][weight_name]) for u,v in edges]
labels = nx.get_edge_attributes(G,weight_name)
nx.draw_networkx_edge_labels(G,pos,edge_labels=labels)
nx.draw_networkx(G, pos, edges=edges, width=weights);
else:
nx.draw_networkx(G, pos, edges=edges);
plot_graph(G, weight_name=None)
plt.savefig('example.png')
plt.show()
But here is the problem,
the nx.get_node_attributes() and nx.draw_networkx_labels() functions will not include dictionary keys (in this example, 'type') on the labels (this works only for nx.get_edge_attributes() and nx.draw_networkx_edge_labels()), and if one would to use nx.get_node_attributes() and nx.draw_networkx_labels(), original node names will be replaced by attribute values.
I am wondering if there're alternative methods to label attribute in dictionary format outside each node while keeping node names inside the nodes? How should I modify my current code?
解决方案
The issue of nx.draw_networkx_labels() not including keys can be solved by creating a new dict that will hold strings representing whole dicts as values.
node_attrs = nx.get_node_attributes(G, 'type')
custom_node_attrs = {}
for node, attr in node_attrs.items():
custom_node_attrs[node] = "{'type': '" + attr + "'}"
Regarding drawing node names and attributes, you can use nx.draw() to normally draw node names and then nx.draw_networkx_labels() to draw attributes -- here you can manually shift attribute positions to be above or below nodes. In the block below pos holds node positions and pos_attrs holds attribute positions placed above appropriate nodes.
pos_nodes = nx.spring_layout(G)
pos_attrs = {}
for node, coords in pos_nodes.items():
pos_attrs[node] = (coords[0], coords[1] + 0.08)
Full example:
import networkx as nx
import matplotlib.pyplot as plt
G = nx.Graph()
G.add_nodes_from(['a', 'b', 'c', 'd', 'e', 'f', 'g'], type = 'machine')
G.add_nodes_from(['h', 'i', 'j'], type = 'human')
G.add_edges_from([('a', 'c'), ('a', 'b'), ('a', 'd'), ('a', 'f'), ('b', 'd'), ('b', 'e'), ('b', 'g'), ('c', 'f'), ('c', 'd'), ('d', 'f'), ('d', 'e'), ('d', 'g'), ('e', 'g'), ('f', 'g'), ('f', 'h'), ('g', 'h'), ('h', 'i'), ('i', 'j')])
plt.figure()
pos_nodes = nx.spring_layout(G)
nx.draw(G, pos_nodes, with_labels=True)
pos_attrs = {}
for node, coords in pos_nodes.items():
pos_attrs[node] = (coords[0], coords[1] + 0.08)
node_attrs = nx.get_node_attributes(G, 'type')
custom_node_attrs = {}
for node, attr in node_attrs.items():
custom_node_attrs[node] = "{'type': '" + attr + "'}"
nx.draw_networkx_labels(G, pos_attrs, labels=custom_node_attrs)
plt.show()
Output:

A final tip: if you have many edges and your node attributes are hard to read, you can try to set the color of edges to a lighter shade of gray.


 1391
1391


 被折叠的 条评论
为什么被折叠?
被折叠的 条评论
为什么被折叠?
 到【灌水乐园】发言


