


Link:Remote IIS Debugging : Debug your ASP.NET Application which is hosted on "Remote IIS Server"
Table of Content
- Background
- Introduction
- Visual StudioDebugging Features for ASP.NET
- Why RemoteDebugging
- RemoteDebugging Tool
- Start RemoteDebugging Tool
- Attach Process from Remote System
- Debugging For Multiple User
- Some Important Tips while remotedebugging
- Summary
- Reference
Background :
In the last month I have published an article on Debugging of ASP.NET Application that hosted on IIS server using process attaché. And I have got a very good response from all the readers, speciallyYankee Imperialist Dog! ,Pete O'Hanlon,Dr.Luiji ,Manas Bhardwaj and many others . And they have suggested me for a follow up article on IIS Remotedebugging. Thanks to all of them for their feedback and giving me another opportunity to write an article. I think this will help you all. Please give your valuable suggestions and feedback to improve on my article.
Introduction :
Before starting with this article, I will request you to read my previous articleDebug Your ASP.NET Application that Hosted on IIS : Process Attach and Identify which process to attach . This article will give you the basic understanding ofDebugging ASP.NET Application that is hosted on Local Server, along with Process selection among multiple processes. And article was all about if you have IIS installed in local server, that means you have hosted your site on your local development environment or your Web server/ production server having visual studio installed. But this is not the real scenario.
Now coming back to this article, this article is all about the IIS remote debugging. You are developing your application in you local system which is hosted on remote web server and now you need todebug it. How will you do that ? This article will describe all the necessary steps likehow to configure remote debugging,attaching process from remote server, start debugging etc. This is one of the most challenging task in ASP.NET. Hope I have explained it clearly.
Visual Studio Debugging Features for ASP.NET
We can have three different way to debug our application from Visual Studio. They are:
Visual Studio Internal DebuggerLocal IIS DebuggingRemote IIS Debugging
Visual Studio Internal Debugger :
We are all aware of that visual studio is having its own internal ASP.NETdebug engine which is used to debug our ASP.NET web application while we are developing it. The process which is used todebug the application within visual studio isWebDev.WebServer.Exe . ASP.NET Engine uses WebDev.WebServer.exe todebug the application. Now if you want to know more details about it please readthis .
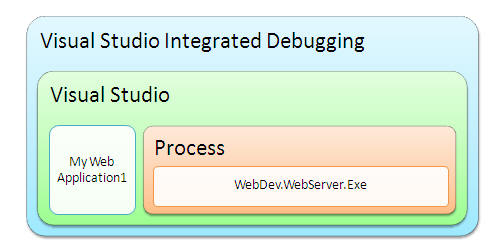
Fig: Block Diagram for Visual Studio Internal Debugger
Local IIS Debugging :
This is all about mylast article . Just brush up the things, I am explaining the whole scenario using following diagram. [ Though it was not necessary, because I have already explained it in my last article, still I have used only for the co-relation with the remotedebugging. ]
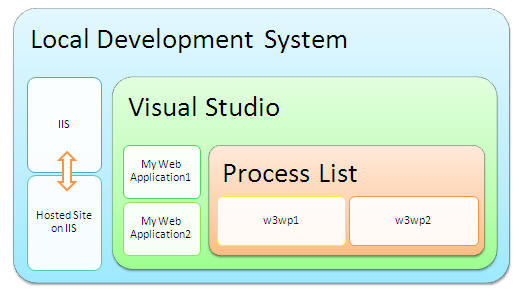
Fig: Block Diagram for Debugging ASP.NET site from Local IIS Server
In local IIS debugging, IIS should be installed in the local system where we have visual studio installed. Fordebugging the application hosted on IIS from visual studio, we need to attach the worker process (w3wp.exe) with in visual studio. After that we will able to start thedebugging of the web application.
Remote IIS Debugging :
This is the main topic which we should cover in this article. It is one of the best features and it is very much helpful whenwe do not have a IIS Server installed in local system or when we have to store the applications at a centralized location. The scenario comes when you are having with your application code in your system and the build which was deployed on different IIS server. Below diagrams shows the overall diagram for remote debugging.
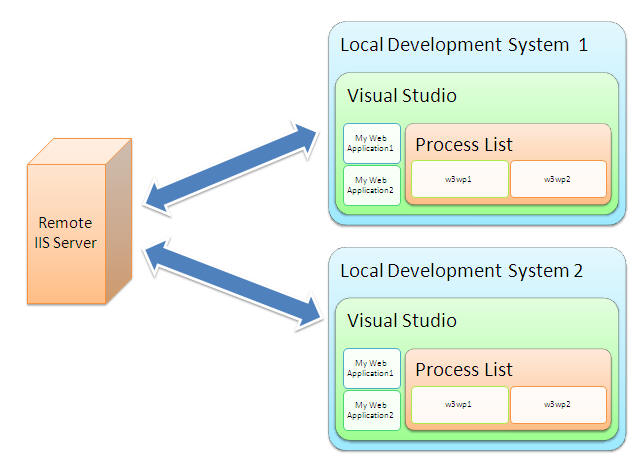
Fig: Block Diagram for Remote debugging of ASP.NET Application
Remote debugging with Visual studio and Remote IIS is very easy to setup. The tool which is used to setup and configure the process is know as"msvsmon.exe". I have describe each and every steps to start, configure the msvsmon tool anddebug the application. But before that just have a look on why should we need remotedebugging.
Why Remote Debugging :
Before going into details, we need to know when we have to use remotedebugging,
-
Local development server does not have IIS installed.
-
Development server and Build/Released/Hosting Server is different
-
Application located in centralized location.
Remote Debugging Tool
The tool which is used to remote debugging of the ASP.Net application know as "Msvsmon.exe" . The RemoteDebugging tool (Msvsmon.exe) is a small windows based application that Visual Studio 2005 uses for remotedebugging. It has very simple UI which makes it very simple to setup and configure During remotedebugging, Visual Studio 2005 runs on one computer and the RemoteDebugging Tool runs on the remote computer along with the application you aredebugging.
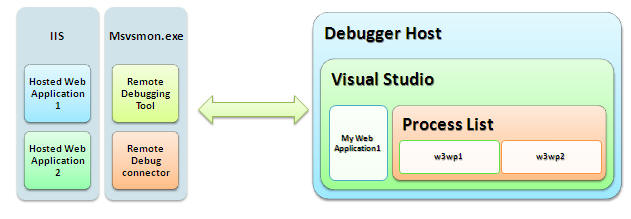
Fig: Block Diagram for Remote debugging of ASP.NET Application with msvsmon
If we want to debug the application which is hosted on remote IIS, we have to start the msvsmon.exe to the remote server, and our development system is thedebugger host where we will debug our code.
Start msvsmon.exe
Msvsmon.exe is installed to the following paths:Install path\Microsoft Visual Studio 8\Common7\IDE\Remote Debugger\x86
First of all we need to Run the Application from the location and we will get following screen,
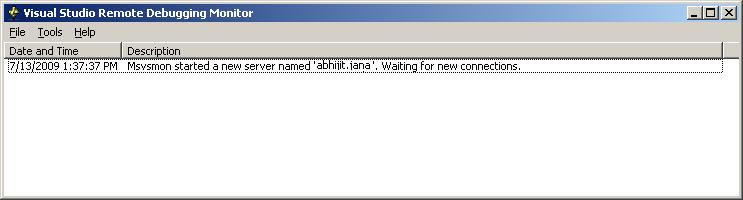
Fig: Initial startup of msvsmon.exe
At the time of starting of application the window will show the status message"Msvsmon started a new server named '. Which meansDebugging monitor tool is ready to connect with some remote server. Now I can connect with this remote server and get the list of all process that is running on the server.<ServerName>'. Waiting for new connection"
Configure Authentication Mode
Configuration of msvsmon tool is very easy. The main configuration is involves with the authentication mode. Msvsmon support two types of authentication
Windows AuthenticationNo-Authentication
Windows Authentication
Msvsmon provide highlevel security with the windows authentication mode. The user who want todebug the application remotely he should be authenticated, means he should have sufficient permission to access thedebugging facility from the remote system. For Setup the Windows authentication mode, We have go"Tool" > "Options" . Following window will appear,
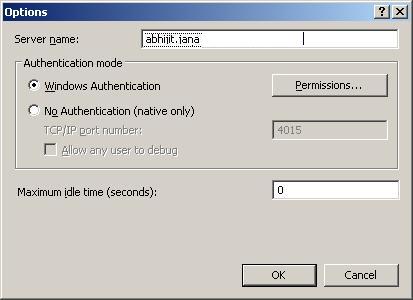
Fig: Setup and configure security settings
Now we have a permission button along with the windows authentication radio button. Using that, we can give permission to any user who belongs to that windows group. If we click on the Permission button, following screen will appear
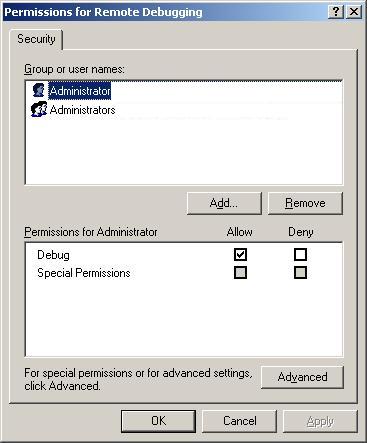
Fig: Add user for windows authentication
By default, Administrator should have the permission for remote debugging, we can use add button to add new user and can give the Debug access or Deny theDebug persmission to any user. For example, I have added myself by just clicking on Add button and take the access control.
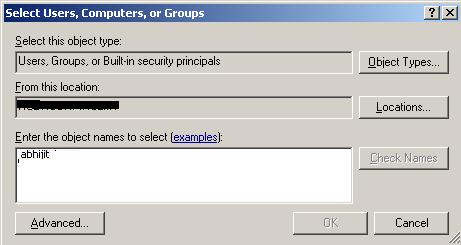
Fig: Add user for windows authentication
Now, I have give me the permission for debugging from remotely (fromDebugger Host).
![]()
Fig: Debug permission for selected user
Similiarly we can select any user from Active Directory and can deny the request for remotedebugging though the user is Windows authenticated user.
I have discussed about how to debug remotely with windows authentication mode in the process attache section.
No-Authentication
There is no security involved with this authentication mode. Any one candebug remotely, if the authentication mode is set to"No-Authentication". As thisdebugging mode is not at all secure, so it should be used only on secure network.
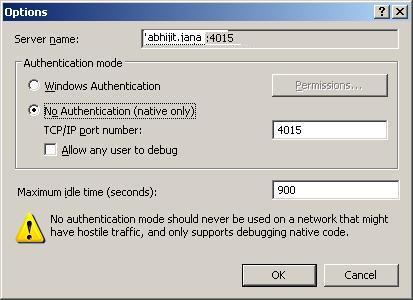
Fig: No-Authentication Mode Configuration
No Authentication mode only supports native debugging. You can also guess the behaviour from the warning message. We have a "Allow any User toDebug" check box. If we checked that one, any user can able todebug.
In the next section I have described, how to attach the process for remote debugging for both Windows and No Authentication Mode.
Attach Process from Remote System
Now, Remote Debugger is ready to accept a new connection to start remotedebugging. And we have already gone through how to configure the msvsmon for both windows and No-Authentication mode. Now we will check how to connect with them and startdebugging,
Before what we need to do, we have created a Web application and hosted it IIS where msvsmon is running, We need to connect it from our local system where we are having our code. Now lets have a look in the case of windows authentication mode
"15">Process Attach - Windows Authentication Mode
"15">Process Attach - Windows Authentication Mode
First of all we need to open the application from visual studio in our development system. Now we need to attach the process from remote server. GotoTool > Attach Process
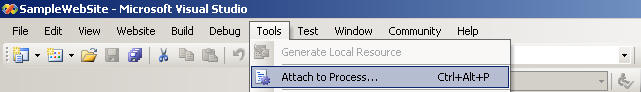
Fig: Attach Process From Visual Studio
When we will click on the "Attach to Process" we will get the following screen .
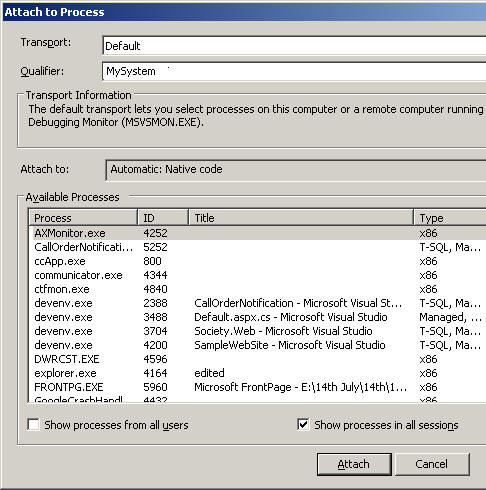
Fig: Default Process List
Right now it is showing all the process that are currently running on the system. Now we need to connect it the remote system. Now I have already started a msvsmon with name"abhijit.jana" and it is waiting for a new connection.
Fig: msvsmon is running on remote host
Now, I am going to connect with the remote system from my local visual studio IDE. So, what we need to do. We have to give the remote server name to the Qualifier section in attach process window.
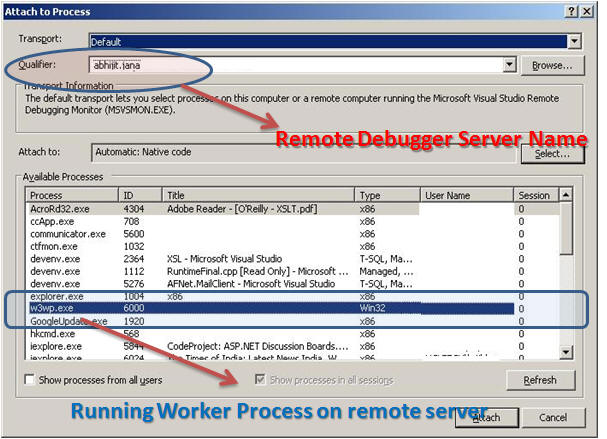
Fig: Connect with Remote host and get the list of process
Now, in the process list all the process are listed from remote server along with Worker Process ((w3wp.exe). Now this is the exact worker process which we need to attach with our code. One more thing, when we are getting the list of process from it means remote server is connected. Now if we check the msvsmon window, it will show another message that user is connected. Have a look into the screenshot
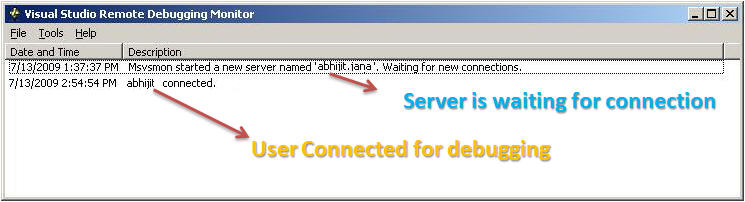
Fig: Debug monitor showing message of connection
Now, our application is ready to debug. just set a break point in your code and enjoy thedebugging. Here is our web site [ Hosted on Remote IIS Server] and which having a server side button, and I want to debug the application on the click of button.
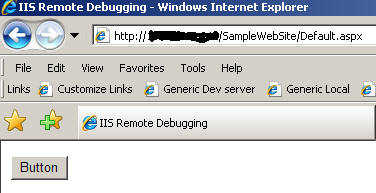
Fig: Access site from Host URL
Now process is attached in our visual studio and I have set the breakpoint on the button click method. Here is outcome.
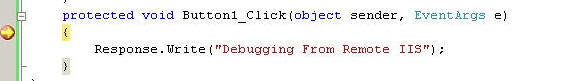
Fig: Debugger at breakpoint
So, let enjoy the debugging from remote server . Now lets have a look how will we remotedebug in No-Authentication mode.
"16">Process Attach - No Authentication Mode
This is quite similar to windows authentication process attach. I have already discussed that, how to configure the No-Authentication mode in remotedebugger. We have to attach the process similar way that I have discussed. There are some few changes. Transport mode should be selected to -Remote (Native only with no authentication) [ Check the Screen shots] .And we need to provide the qualifier "abhijit.jana: 4015
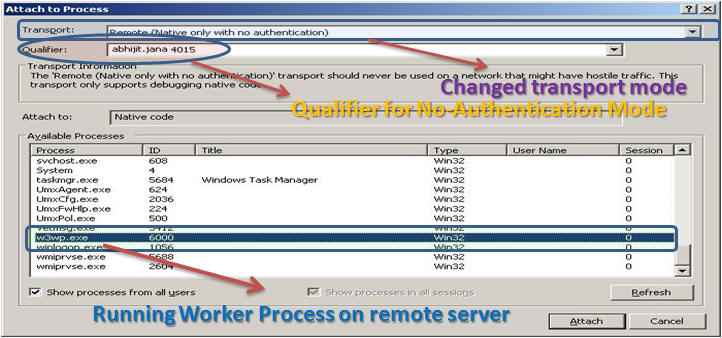
Fig: Process Attach for No-Authentication Mode
So, now we need to attach the worker process and need to start debugging, on which I have already discussed. There is slight change in connect while remotedebugging going on with No-Authentication mode.Debugging monitor will display a message on the window thatdebugging is running on no authentication mode.
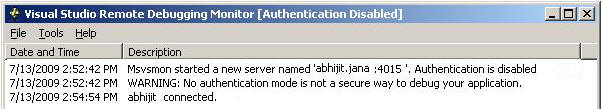
Fig: Status message for No-Authentication Mode
So, this is all about how to debug you application from remote IIS server in both windows and No-Authentication mode.
Debugging For Multiple User
This is one of the most fantastic features of Msvsmon tool. Msvsmon debugging monitor tool allow multiple user todebug simultaneously. . Each instance of the remotedebugger has a unique server name. As I have already shown that Server names are configurable, so we can give an instance of the remotedebugger any server name. Now multiple user can able to access the same
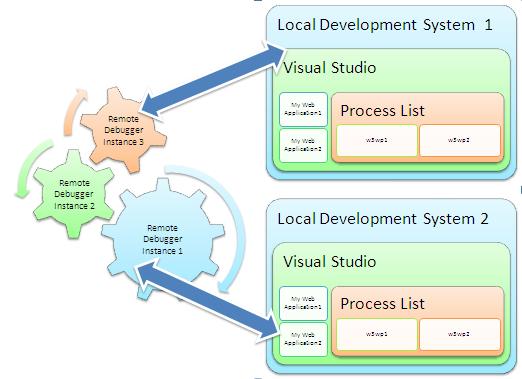
Fig: General block diagram from Multiple Debugger instance
Some Important Tips while remote debugging
- Visual Studio 2005 remote debugging components must be installed on the remote computer
- we must reference the remote computer by using a computer name instead of an IP address.
- The Web.config file for the ASP.NET application must not contain any errors, and the compilation element must have thedebug attribute set to True.
- Make sure that a firewall is not blocking remote debugging.
- The security setting for the site must allow Integrated Windows authentication.
- Make sure that the Remote Debugging Monitor is running on the remote server. If Msvsmon.exe is not running, you receive the following error message.
Summary :
Now to finalize the things, just take a quick summary. msvsmon is an utility which provides the facility todebug the application which is hosted on remote IIS server. It provides two kind of authentication mode, Windows and No-Authentication Mode. In Case of windows authentication mode the user should need the permission to access the instance of remote debugger but on the other hand No-Authentication does not required and security permission.
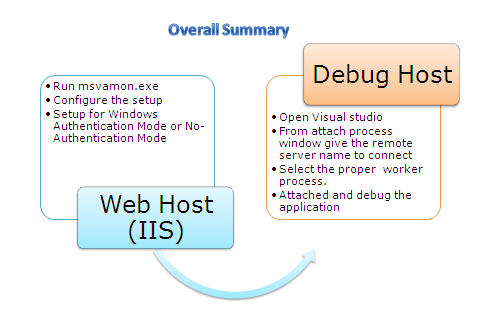
Fig: Overall Summary
Hope this article will help you to learn about remote debugging. Please Don't forget give your suggestion and Feedback for imporvement.


 133
133


 被折叠的 条评论
为什么被折叠?
被折叠的 条评论
为什么被折叠?
 到【灌水乐园】发言


