


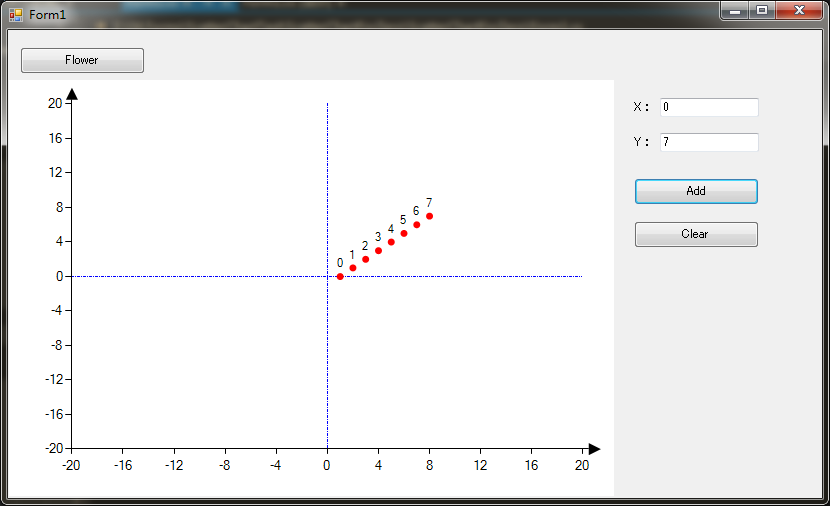
如上图,8个点的X坐标都为0,但是画的位置都不对,代码如下


  1 using System;
  2 using System.Collections.Generic;
  3 using System.ComponentModel;
  4 using System.Data;
  5 using System.Drawing;
  6 using System.Linq;
  7 using System.Text;
  8 using System.Threading.Tasks;
  9 using System.Windows.Forms;
 10 using System.Windows.Forms.DataVisualization.Charting;
 11
 12 namespace ScatterChartForZero
 13 {
 14     public partial class Form1 : Form
 15     {
 16         private int _fAxesArea = 20;
 17         private readonly string POINT_SERIES_NAME = "POINT";
 18
 19         public Form1()
 20         {
 21             InitializeComponent();
 22         }
 23
 24         private void Form1_Load(object sender, EventArgs e)
 25         {
 26             InitTestChart();
 27         }
 28
 29         private void InitTestChart()
 30         {
 31             TestChart.GetType().GetProperty("DoubleBuffered", System.Reflection.BindingFlags.Instance | System.Reflection.BindingFlags.NonPublic).SetValue(TestChart, true, null);
 32             TestChart.ChartAreas.Add(CreateChartArea());
 33             Series s = CreatePointSeries(POINT_SERIES_NAME, Color.Red, 7);
 34             List<PointF> points = new List<PointF>();
 35             points.Add(new PointF(0, 0));
 36             UpdatePoints(s, points);
 37             TestChart.Series.Add(s);
 38         }
 39
 40         private List<PointF> MakeTestData()
 41         {
 42             int count = 30;
 43             float a = 7.5f;
 44             float b = 15;
 45             List<PointF> list = new List<PointF>();
 46             for (int i = 0; i < count; i++)
 47             {
 48                 list.Add(new PointF(0, 0));
 49                 list.Add(new PointF(a, a));
 50                 list.Add(new PointF(-a, -a));
 51                 list.Add(new PointF(a, -a));
 52                 list.Add(new PointF(-a, a));
 53                 list.Add(new PointF(b, b));
 54                 list.Add(new PointF(-b, -b));
 55                 list.Add(new PointF(-b, b));
 56                 list.Add(new PointF(b, -b));
 57             }
 58
 59             return list;
 60         }
 61
 62         private ChartArea CreateChartArea()
 63         {
 64             ChartArea _caArea = new ChartArea
 65             {
 66                 #region //Set X Axis
 67
 68                 Name = "Default",
 69                 AxisX =
 70                 {
 71                     ArrowStyle = AxisArrowStyle.Triangle,
 72                     IntervalAutoMode = IntervalAutoMode.VariableCount,
 73                     Interval = 2 * _fAxesArea / 10 > 0.1 ? 2 * _fAxesArea / 10 : 0.1,
 74                     Maximum = _fAxesArea,
 75                     Minimum = -_fAxesArea,
 76                     MajorGrid = new Grid()
 77                     {
 78                         Enabled = false,
 79                     }
 80                 },
 81                 #endregion
 82
 83                 #region //Set Y Axis
 84
 85                 AxisY =
 86                 {
 87                     ArrowStyle = AxisArrowStyle.Triangle,
 88                     IntervalAutoMode = IntervalAutoMode.VariableCount,
 89                     Interval = 2 * _fAxesArea / 10 > 0.1 ? 2 * _fAxesArea / 10 : 0.1,
 90                     Maximum = _fAxesArea,
 91                     Minimum = -_fAxesArea,
 92                     MajorGrid = new Grid()
 93                     {
 94                         Enabled = false
 95                     }
 96                 }
 97                 #endregion
 98             };
 99
100             #region Set Strip Line
101
102             StripLine slx = new StripLine()
103             {
104                 BorderColor = Color.Blue,
105                 BorderDashStyle = ChartDashStyle.DashDot,
106             };
107             _caArea.AxisX.StripLines.Clear();
108             _caArea.AxisX.StripLines.Add(slx);
109
110             StripLine sly = new StripLine()
111             {
112                 BorderColor = Color.Blue,
113                 BorderDashStyle = ChartDashStyle.DashDot,
114             };
115             _caArea.AxisY.StripLines.Clear();
116             _caArea.AxisY.StripLines.Add(sly);
117             #endregion
118
119             return _caArea;
120         }
121
122         private Series CreatePointSeries(string name, Color color, int width)
123         {
124             Series series = new Series
125             {
126                 XAxisType = AxisType.Primary,
127                 Name = name,
128                 ChartType = SeriesChartType.Point,
129                 IsXValueIndexed = false,
130                 MarkerSize = width,
131                 Color = color,
132                 MarkerStyle = MarkerStyle.Circle,
133                 BorderDashStyle = ChartDashStyle.Dot,
134                 IsValueShownAsLabel = true,
135                 SmartLabelStyle = new SmartLabelStyle() {
136
137                 },
138             };
139             return series;
140         }
141         private void UpdatePoints(Series series, List<PointF> points)
142         {
143             double[] xArray = new double[points.Count];
144             double[] yArray = new double[points.Count];
145             for (int i = 0; i < points.Count; i++)
146             {
147                 var item = points[i];
148                 xArray[i] = item.X;
149                 yArray[i] = item.Y;
150             }
151             series.Points.DataBindXY(xArray, yArray);
152         }
153         private void AddPoints(Series series, List<PointF> points)
154         {
155             for (int i = 0; i < points.Count; i++)
156             {
157                 var item = points[i];
158                 series.Points.AddXY(item.X, item.Y);
159             }
160         }
161         private void ClearPoints(Series series)
162         {
163             series.Points.Clear();
164         }
165
166         private void btAdd_Click(object sender, EventArgs e)
167         {
168             double x,y;
169             if (!double.TryParse(tbX.Text, out x)|| !double.TryParse(tbY.Text, out y))
170             {
171                 return;
172             }
173
174             this.TestChart.Series[POINT_SERIES_NAME].Points.AddXY(x,y);
175         }
176
177         private void btClear_Click(object sender, EventArgs e)
178         {
179             this.TestChart.Series[POINT_SERIES_NAME].Points.Clear();
180         }
181
182         private void btFlower_Click(object sender, EventArgs e)
183         {
184             AddPoints(this.TestChart.Series[POINT_SERIES_NAME], MakeTestData());
185         }
186     }
187 }


 5456
5456

 被折叠的 条评论
为什么被折叠?
被折叠的 条评论
为什么被折叠?
 到【灌水乐园】发言


