


叠加图 echarts-canvas
偶遇一个比较奇怪的需求,是一个叠加图(superpostion chart),设计图如下
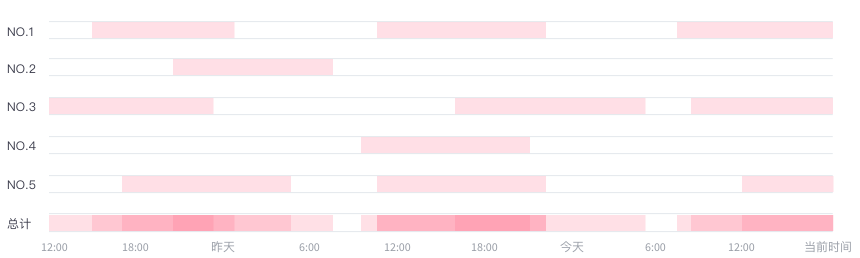
有5个不同的设备不同时间在线,总计体现出每个时间段的在线热度,本来想用echarts但是没找到特别合适的,所以自己做了一个,希望能给需要的人帮助。
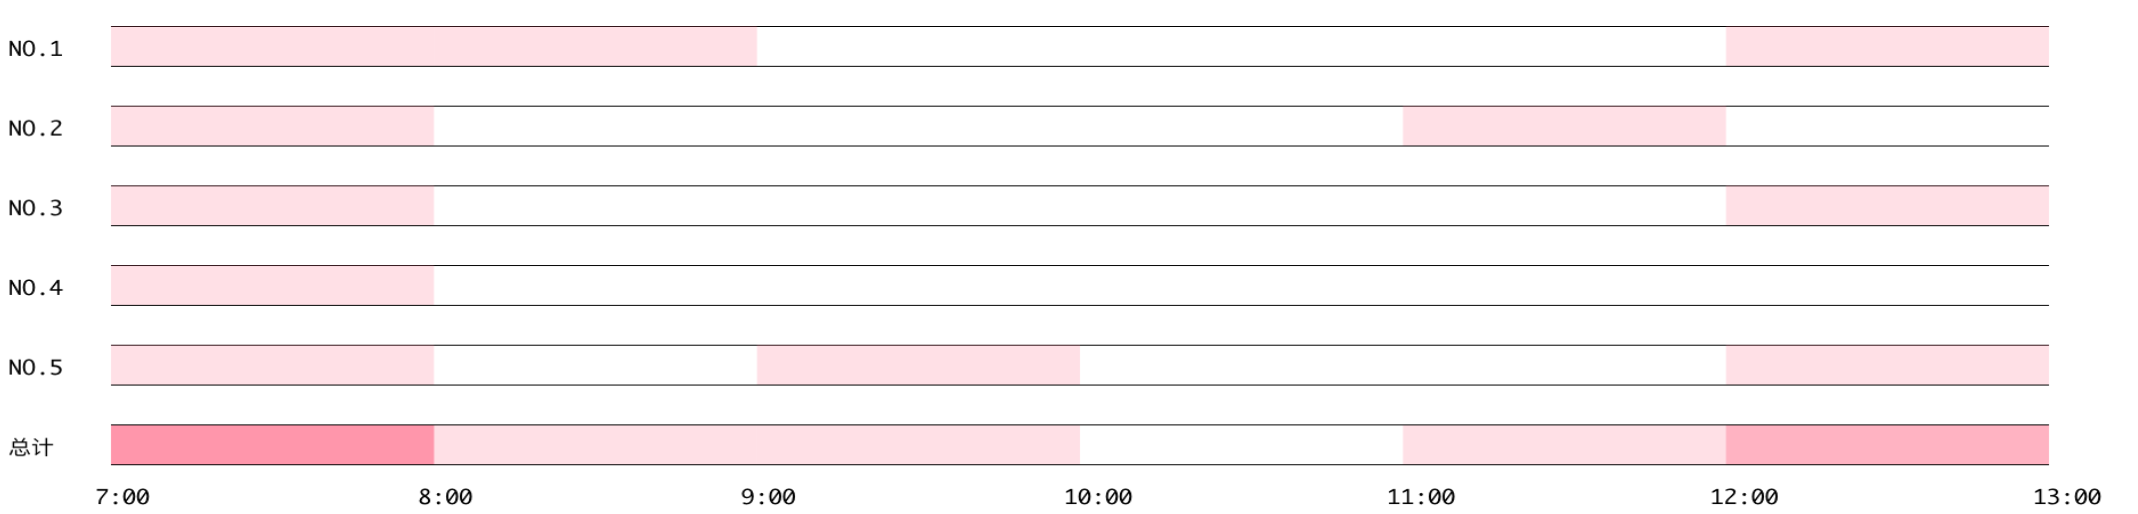
最终效果如下
首先需要一个canvas
<canvas id="canvasoffline" class="imgdevice"></canvas>然后是绘图方法:
function superPosition (ele, opts) {
  let opt = opts||{
    data: dataOrg,
    left: 100,
    right: 50,
    grid: 50,
    barwidth: 16,
    font:'12px monaco',
    color: 'rgba(255,99,132,0.2)'
  }
  console.log(dataOrg)
  const length = opt.data.time.length - 1;
  const WID = ele.width;
  const HEI = ele.height;

  const numlength = opt.data.devicelength;
  const ctx = ele.getContext('2d');
  const grid = opt.grid;
  const start = opt.left;
  const end = opt.right;
  const interval = (WID- start - end ) / length;


  for(var num = 0 ; num < numlength; num ++){
    ctx.save();
    ctx.font = opt.font;
    ctx.fillText("NO."+(num+1),60, opt.barwidth+num*grid - 10);
    // for(let i = 0; i <= length; i ++){
    //   ctx.fillText(data.time[i] ,i * interval + start - 14 , 33+num*grid);
    // }
    ctx.fillRect(start, 0+num*grid, WID-start-end, 1);
    ctx.fillRect(start, opt.barwidth+num*grid, WID-start-end, 1)
    ctx.fillStyle = opt.color

    let ms = 'no'+(num+1);
    dataOrg[ms].forEach((e,i) => {
      ctx.fillRect(start+(e - 1)*interval,0+num*grid,interval,opt.barwidth);
      ctx.fillRect(start+(e - 1)*interval,0+numlength*grid,interval,opt.barwidth)
    })
    ctx.restore()
  }

  ctx.font = opt.font;
  ctx.fillText("总计",60, opt.barwidth+grid*num - 10);
  ctx.fillRect(start, 0+num*grid, WID-start-end, 1);
  ctx.fillRect(start, opt.barwidth+num*grid, WID-start-end, 1)
  for(let i = 0; i <= length; i ++){
    ctx.fillText(opt.data.time[i] ,i * interval + start - 14 , opt.grid + num*grid);
  }
}
上面是实现图的代码,使用方法如下
var dataOrg = {
  time: ['7:00','8:00',"9:00","10:00","11:00","12:00","13:00"],//y轴
  no1: [1,2,6], //各个设备的数据,1,2,6代表第一二六个时间段在线
  no2: [1,5],
  no3: [1,6],
  no4: [1],
  no5: [1,3,6],
  devicelength: 5 //设备总数
}

const ele = document.querySelector('#canvasoffline'); //获取元素
ele.height = 80 * (dataOrg.devicelength+1) + 20 ; //图片高度
ele.width = ele.height * 4; //图片宽度

 const opts = {
  data: dataOrg, //数据来源
  left: 150, //图左侧空白
  right: 150, //图右侧空白
  grid: 80, //垂直间距
  barwidth: 40, // 柱子宽度
  font:'20px monaco', //字体
  color: 'rgba(255,99,132,0.2)' //颜色,叠加状态若要好看需要透明度低
}

superPosition(ele, opts) //执行
最后你还需要添加样式让这个元素不会很大
.imgdevice {
width: 100%;
height: 300px;
padding-top: 50px;
border-top: 1px solid rgba(244,243,243,1);
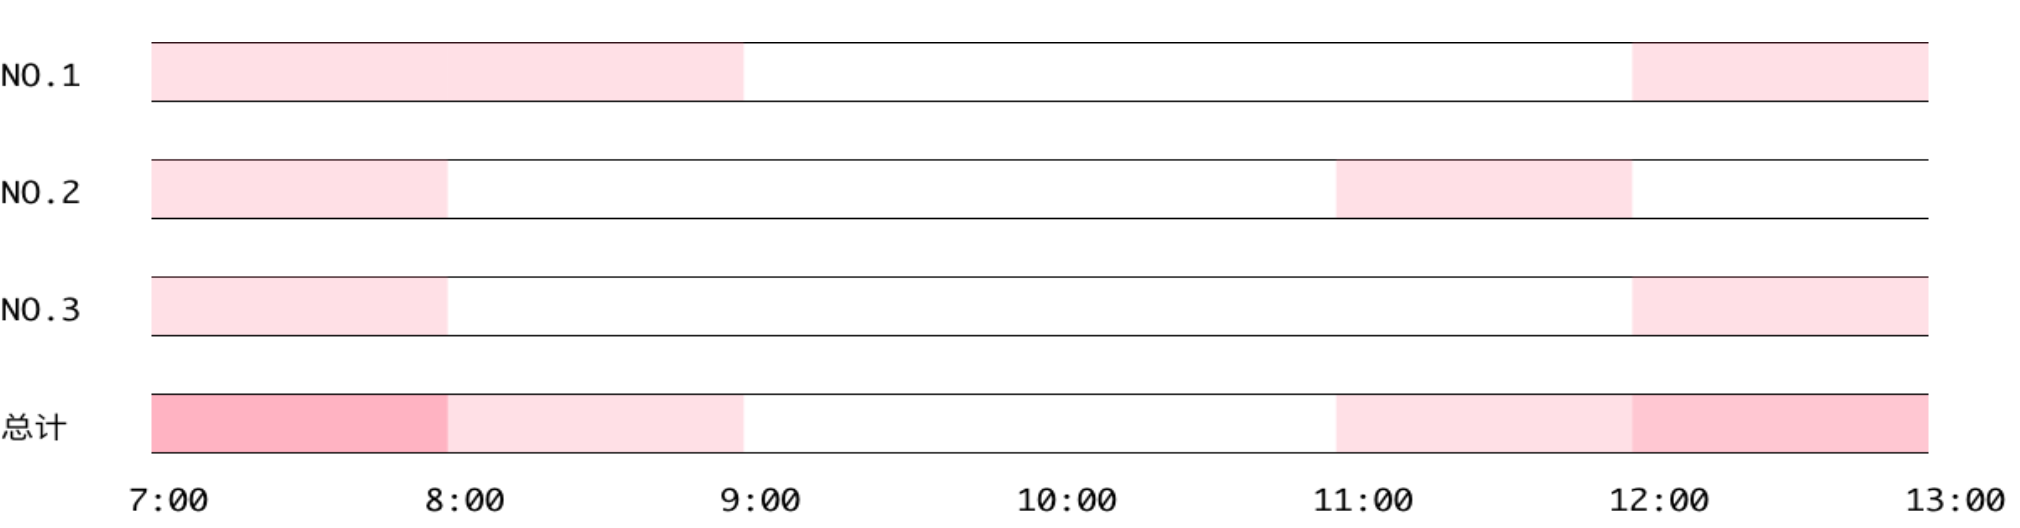
}下面这是三个设备的时候
下面这个是一个设备的时候
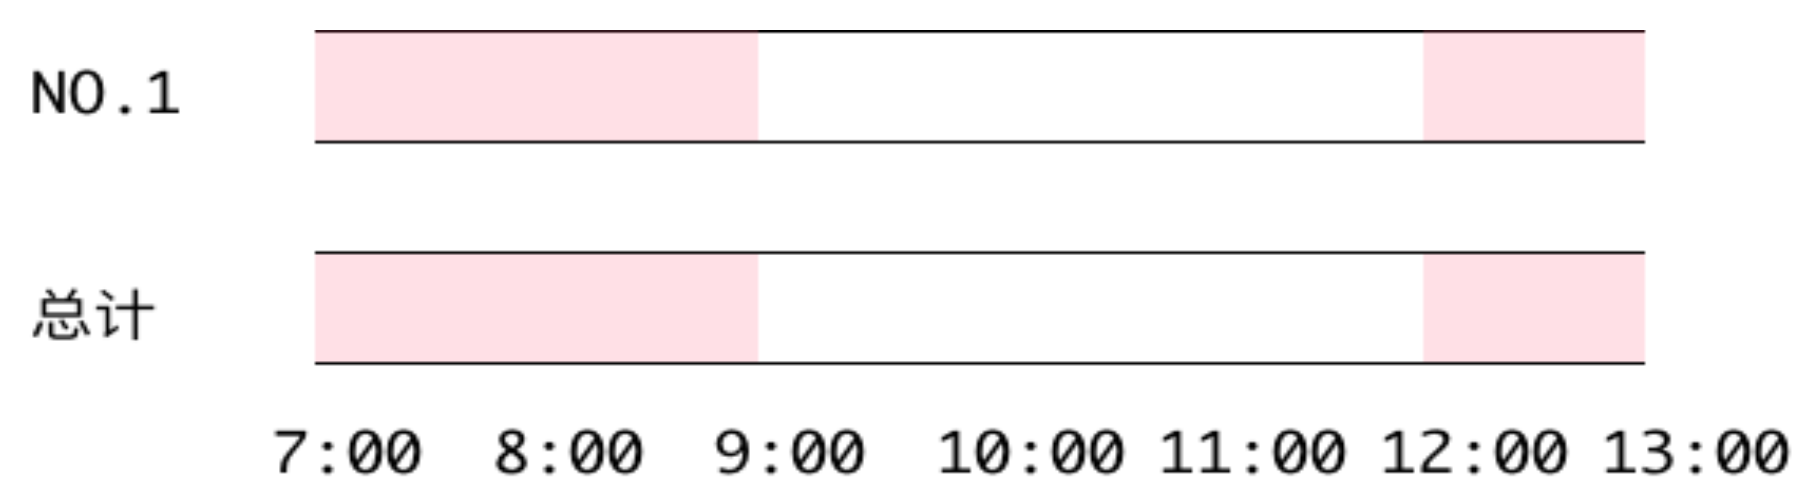
我采用的方法是保持纵横比,拉大图片来解决,自适应性还比较差,希望大家有更好的建议或者改善方法可以告诉我。


 299
299


 被折叠的 条评论
为什么被折叠?
被折叠的 条评论
为什么被折叠?
 到【灌水乐园】发言


