


Debug JavaScript in Chrome
IntelliJ IDEA provides a built-in debugger for your client-side JavaScript code that works with Chrome. The video and the instructions below walk you through the basic steps to get started with this debugger.
Before you startMake sure the JavaScript and TypeScript and JavaScript Debugger required plugins are enabled on the Settings/Preferences | Plugins page, see Managing plugins for details.
Configure the built-in debugger as described in Configuring JavaScript debugger.
To have the changes you make to your HTML, CSS, or JavaScript code immediately shown in the browser without reloading the page, activate the Live Edit functionality. See Live Edit in HTML, CSS, and JavaScript for details.Debug an application that is running on the built-in server
IntelliJ IDEA has a built-in web server that can be used to preview and debug your application. This server is always running and does not require any manual configuration. All the project files are served on the built-in server with the root URL http://localhost:/, with respect to the project structure.Start debugging Set the breakpoints in the JavaScript code, as required.
Open the HTML file that references the JavaScript to debug or select the HTML file in the Project tool window.
From the context menu of the editor or the selection, choose Debug . IntelliJ IDEA generates a debug configuration and starts a debugging session through it. The file opens in the browser, and the Debug tool window appears.To save the automatically generated configuration for further re-use, choose Save from the context menu after the debugging session is over.By default, a debugging session starts in a new window with a custom Chrome user data. To open a new Chrome instance with your familiar look-and-feel, configure Chrome in IntelliJ IDEA to start with your user data, see Starting a debugging session with your default Chrome user data for details.Example
Suppose you have a simple application that consists of an index.html file and an index.js file, where index.html references index.js. To start debugging this application using the built-in server, open index.html in the editor and choose Debug 'index.html' from the context menu: 
IntelliJ IDEA creates a run/debug configuration automatically, and a debugging session starts: 
To restart the new run/debug configuration, click
![]() in the upper right-hand corner of the IntelliJ IDEA window or choose Run | Debug from the main menu:
in the upper right-hand corner of the IntelliJ IDEA window or choose Run | Debug from the main menu:  Debug an application that is running on the localhost in the development mode If your application is running in the development mode on localhost, you can start debugging it from the built-in Terminal (Alt+F12 ), from the Run tool window, or from the Debug tool window. Just hold Ctrl+Shift and click the URL at which the application is running.
  Set the breakpoints in your code.
Start the application in the development mode, for example, using an npm script.
The Run tool window or the Terminal shows the URL at which your application is running. Hold Ctrl+Shift and click this URL link. IntelliJ IDEA starts a debugging session with an automatically generated configuration of the type JavaScript Debug.
This also works for debugging Vue.js, Angular, React, and Node.js applications.Debug an application that is running on an external web server
Often you may want to debug client-side JavaScript running on an external development web server, for example powered by Node.js.Set the breakpoints in the JavaScript code, as required.
Run the application in the development mode. Often you need to run npm start for that.
When the development server is ready, copy the URL address at which the application is running in the browser - you will need to specify this URL address in the run/debug configuration.
Create a debug configuration of the type JavaScript Debug: from the main menu, select Run | Edit Configuration, click
![]() on the toolbar and select JavaScript Debug from the list. In the Run/Debug Configuration: JavaScript Debug dialog that opens, specify the URL address at which the application is running. This URL can be copied from the address bar of your browser as described in Step 2 above. Click OK to save the configuration settings.
on the toolbar and select JavaScript Debug from the list. In the Run/Debug Configuration: JavaScript Debug dialog that opens, specify the URL address at which the application is running. This URL can be copied from the address bar of your browser as described in Step 2 above. Click OK to save the configuration settings.
Select the newly created configuration from the Select run/debug configuration list on the toolbar and click
![]() next to the list. The URL address specified in the run configuration opens in the browser and the Debug tool window appears.Debug asynchronous code
next to the list. The URL address specified in the run configuration opens in the browser and the Debug tool window appears.Debug asynchronous code
IntelliJ IDEA supports debugging asynchronous client-side JavaScript code. IntelliJ IDEA recognizes breakpoints inside asynchronous code, stops at them, and lets you step into such code. As soon as a breakpoint inside an asynchronous function is hit or you step into asynchronous code, a new element Async call from is added in the Frames pane of the Debugger tab. IntelliJ IDEA displays a full call stack, including the caller and the entire way to the beginning of the asynchronous actions.
The image below shows an example of a JavaScript debugging session. 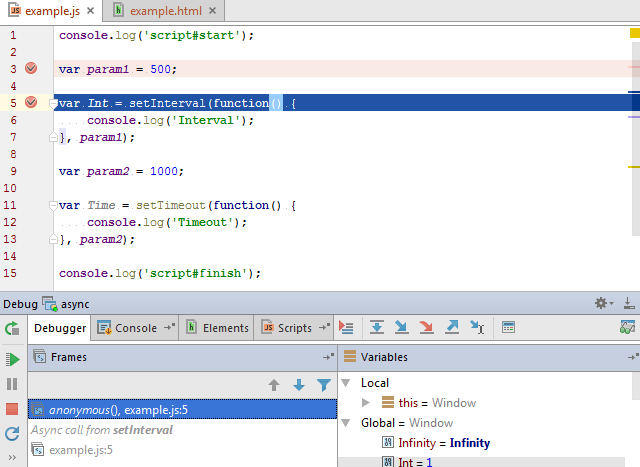 The debugger stops at line3(breakpoint), then at line5(breakpoint). On clicking Step into, the debugger will stop at line5 (on function ), then will move to line6.
The asynchronous debugging mode is turned on by default. To disable asynchronous stack traces, set js.debugger.async.call.stack.depth in Registry to 0.Debug workers
IntelliJ IDEA supports debugging Service Workers and Web Workers. IntelliJ IDEA recognizes breakpoints in each worker and shows the debug data for it as a separate thread in the Frames pane on the Debugger tab of the Debug tool window.
Note that IntelliJ IDEA can debug only dedicated workers, debugging for shared workers is currently not supported.Set the breakpoints in the Workers to debug.
If you are using Service Workers, make sure the Allow unsigned requests checkbox on the Debugger page is selected. Otherwise your service workers may be unavailable during a debug session: 
Create a debug configuration of the type JavaScript Debug as described above in Debugging client-side JavaScript running on an external web server.
Select the newly created configuration from the Select run/debug configuration list on the toolbar and click Debug
![]() .
.
The HTML file specified in the run configuration opens in the chosen browser and the Debug tool window opens with the Frames list showing all the Workers: 
To examine the data (variables, watches, and so on) for a Worker, select its thread in the list and view its data in the Variables and Watches panes. When you select another Worker, the contents of the panes are updated accordingly.
Last modified: 17 May 2021


 992
992


 被折叠的 条评论
为什么被折叠?
被折叠的 条评论
为什么被折叠?
 到【灌水乐园】发言


