


import numpy as np
from sklearn.datasets import load_iris
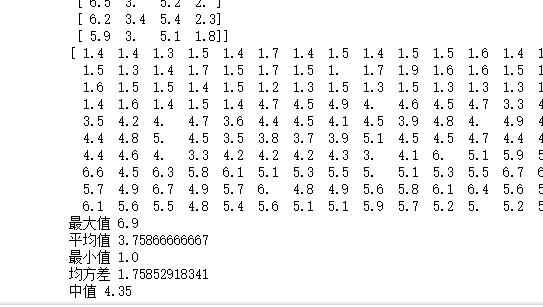
#1.计算鸢尾花花瓣长度的最大值,平均值,中值,均方差。
data=load_iris()
print(data)
print(type(data))
print(data.keys(),data.feature_names)
iris=data.data
print(iris)
petal_length=iris[:,2]
print(petal_length)
print("最大值",np.max(petal_length))
print("平均值",np.mean(petal_length))
print("最小值",np.min(petal_length))
print("均方差",np.std(petal_length))
print("中值",np.median(petal_length))
结果:
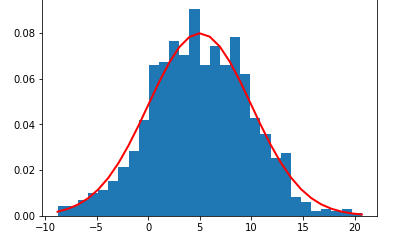
#2.用np.random.normal()产生一个正态分布的随机数组,并显示出来。
import numpy as np
import matplotlib.pyplot as plt
mu = 5
sigma = 5
num = 1000
rand_data = np.random.normal(mu, sigma, num)
count, bins, ignored = plt.hist(rand_data, 30, normed=True)
plt.plot(bins, 1/(sigma * np.sqrt(2 * np.pi)) *np.exp( - (bins - mu)**2 / (2 * sigma**2)), linewidth=2, color='r')
plt.show()
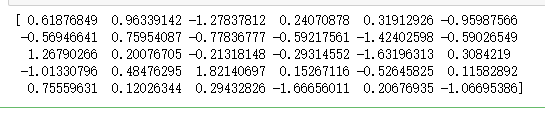
#3.np.random.randn()产生一个正态分布的随机数组,并显示出来。
Data=np.random.randn(30)
print(Data)
结果:
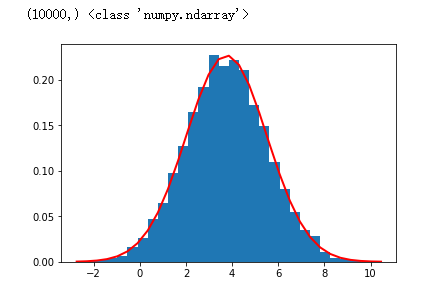
#4.显示鸢尾花花瓣长度的正态分布图
import numpy as np
import matplotlib.pyplot as plt

mu = np.mean(petal_length)  # 期望值
sigma = np.std(petal_length)  # 标准差
num = 10000  #个数为10000

rand_data = np.random.normal(mu, sigma, num)
print(rand_data.shape,type(rand_data))

count, bins, ignored = plt.hist(rand_data, 30, normed=True)
plt.plot(bins, 1/(sigma * np.sqrt(2 * np.pi)) *np.exp( - (bins - mu)**2 / (2 * sigma**2)), linewidth=2, color='r')
plt.show()
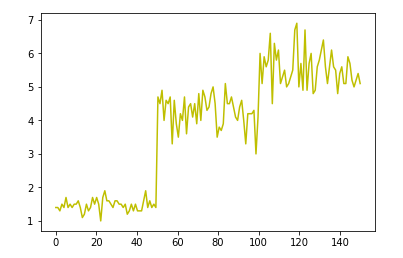
#曲线图
plt.plot(np.linspace(0,150,num=150),petal_length,'y')
plt.show()
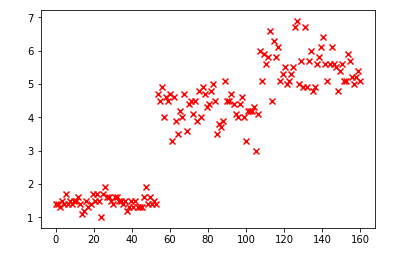
#散点图
plt.scatter(np.linspace(0,160,num=150),petal_length,alpha=1,marker='x',color='red')
plt.show()


 653
653


 被折叠的 条评论
为什么被折叠?
被折叠的 条评论
为什么被折叠?
 到【灌水乐园】发言


