


1.1、配置influxdb yum源
[[email protected] ~]# cat /etc/yum.repos.d/influxdb.repo
[influxdb]
name = InfluxDB Repository - RHEL \$releasever
baseurl = https://repos.influxdata.com/rhel/\$releasever/\$basearch/stable
enabled = 1
gpgcheck = 1
gpgkey = https://repos.influxdata.com/influxdb.key
1.2、安装Grafana+influxdb+telegraf
安装influxdb
yum install influxdb
安装telegraf
yum install telegraf
安装grafana
wget https://dl.grafana.com/oss/release/grafana-6.1.3-1.x86_64.rpm
yum localinstall grafana-6.1.3-1.x86_64.rpm
1.3、软件版本
InfluxDB version: 1.7.4
Telegraf version: 1.10.2
Grafana version: 6.1.3
1.4、启动服务,添加开机启动
systemctl start influxdb.service
systemctl start telegraf.service
systemctl start grafana-server.service
systemctl enable influxdb.service
systemctl enable telegraf.service
systemctl enable grafana-server.service
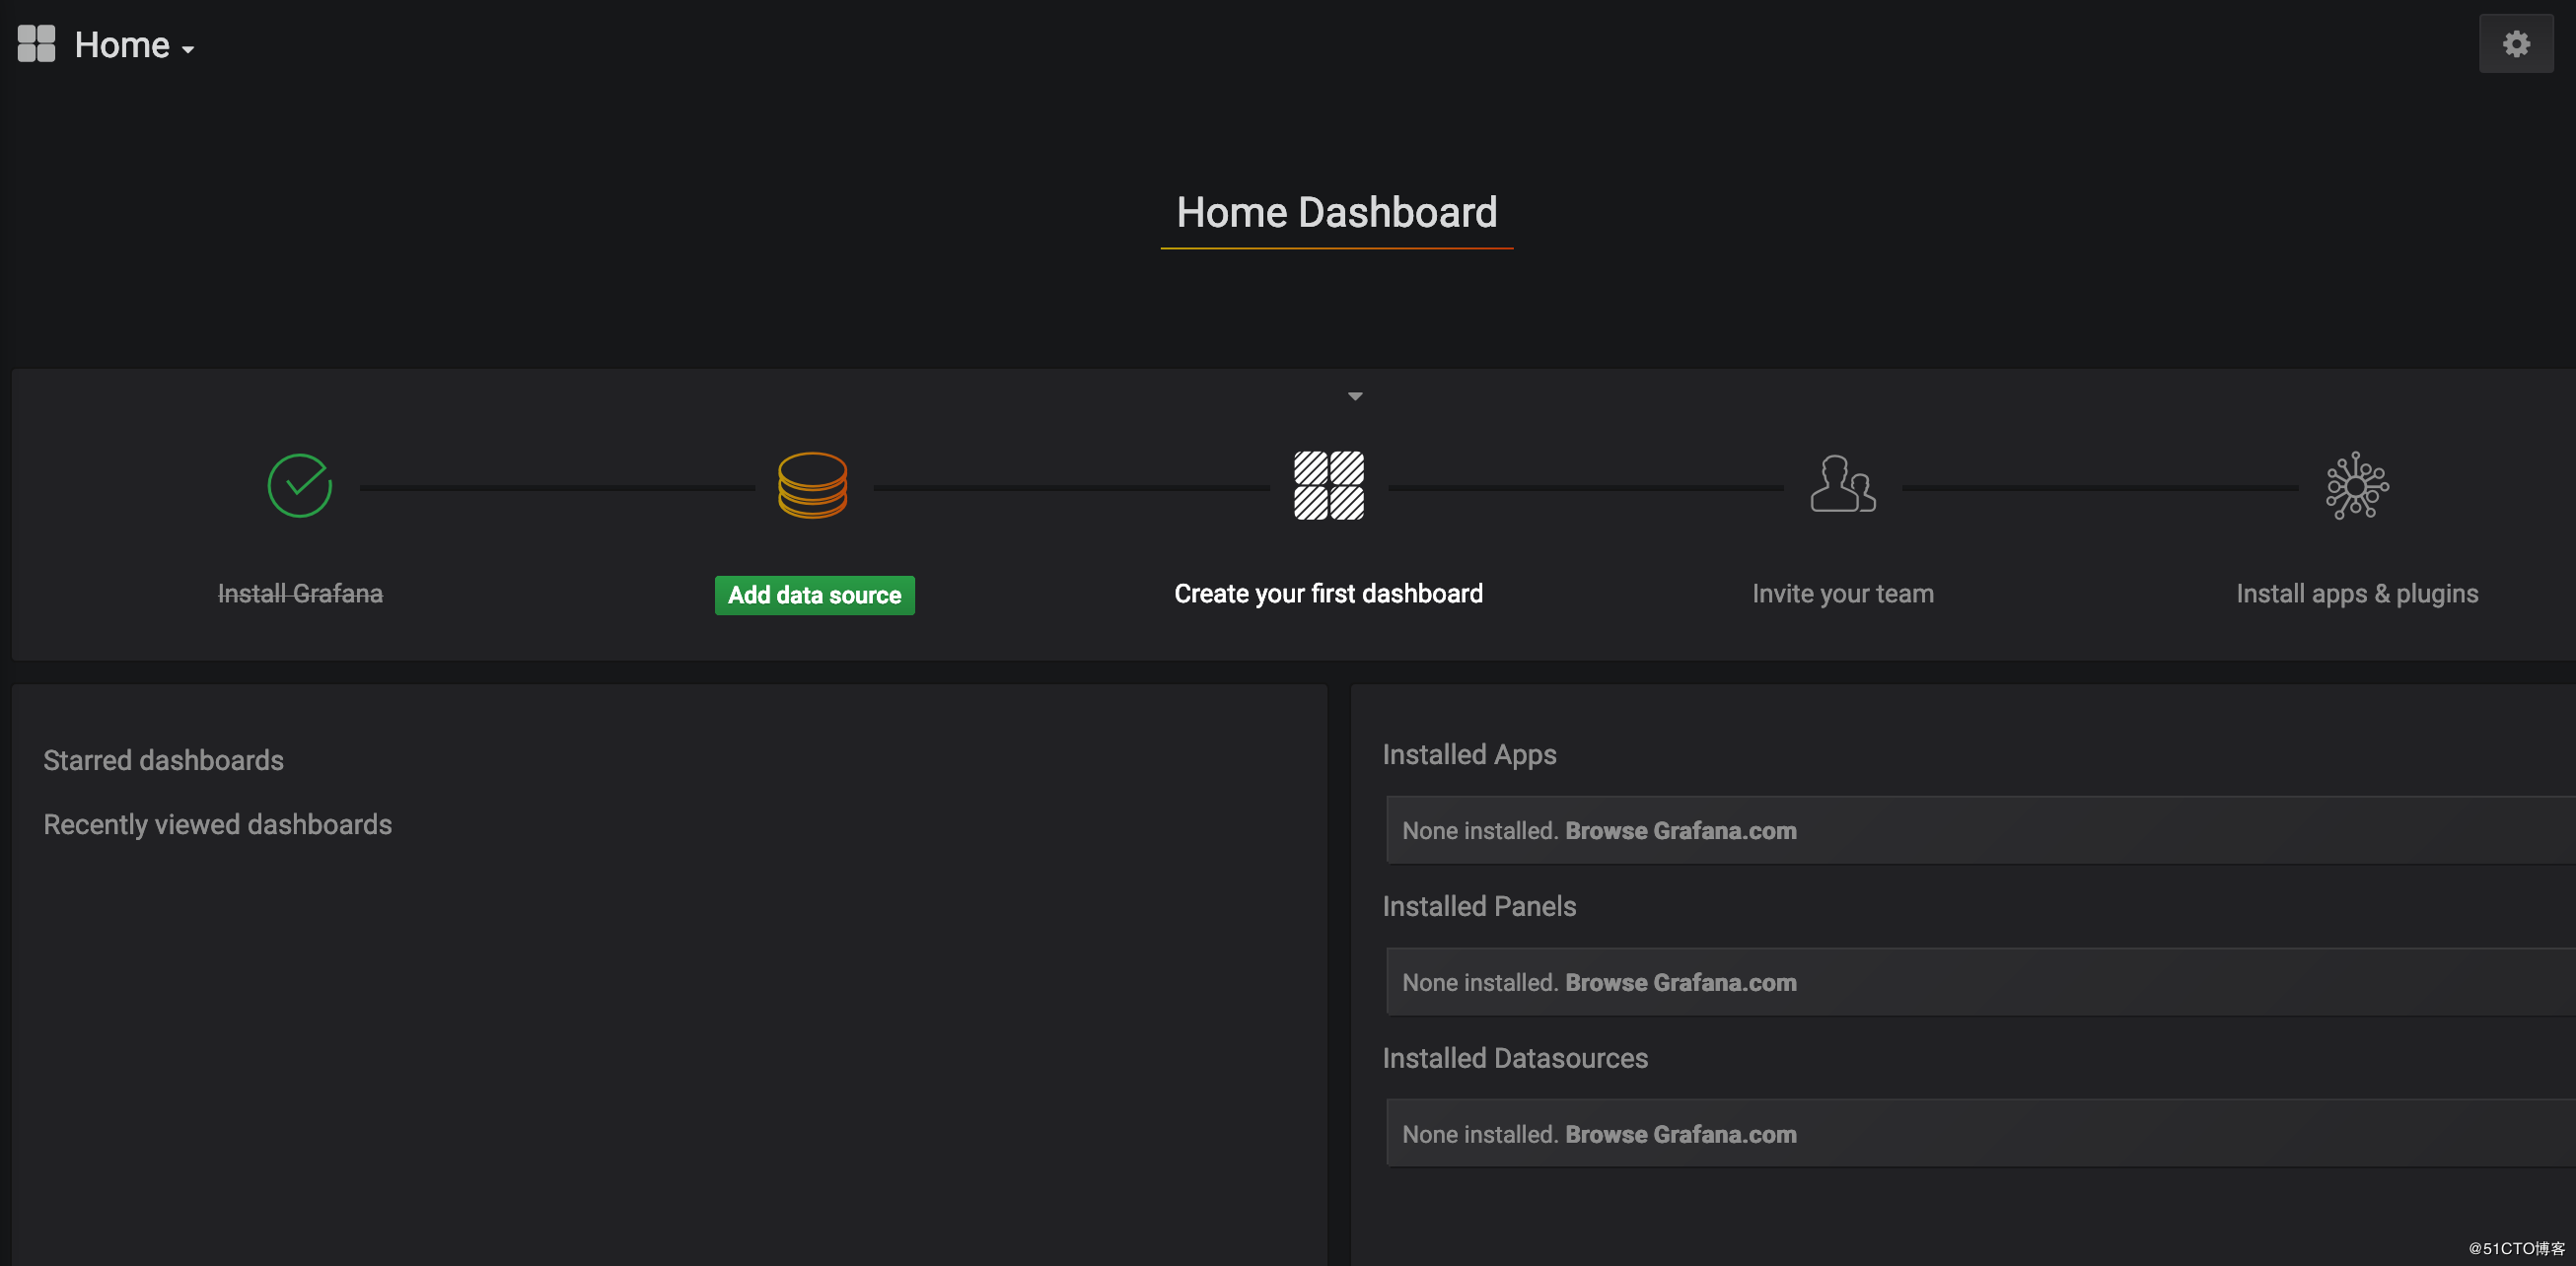
1.5、查看grafana界面
grafana默认监听在3000端口,默认用户名admin,密码admin
二、数据采集之telegraf
Telegraf是用Go写的代理程序,可以用于收集系统和服务的统计数据,是TICK技术栈的一部分。它具备输入插件,可以直接从系统获取指标数据,从第三方API获取指标数据,甚至可以通过statsd和Kafka获取指标数据。它还具备输出插件,可以将采集的指标发送到各种数据存储,服务和消息队列。比如InfluxDB,Graphite,OpenTSDB,Datadog,Librato,Kafka,MQTT,NSQ等等,目前Telegraf尚不支持Oracle数据库统计数据的实时监控。
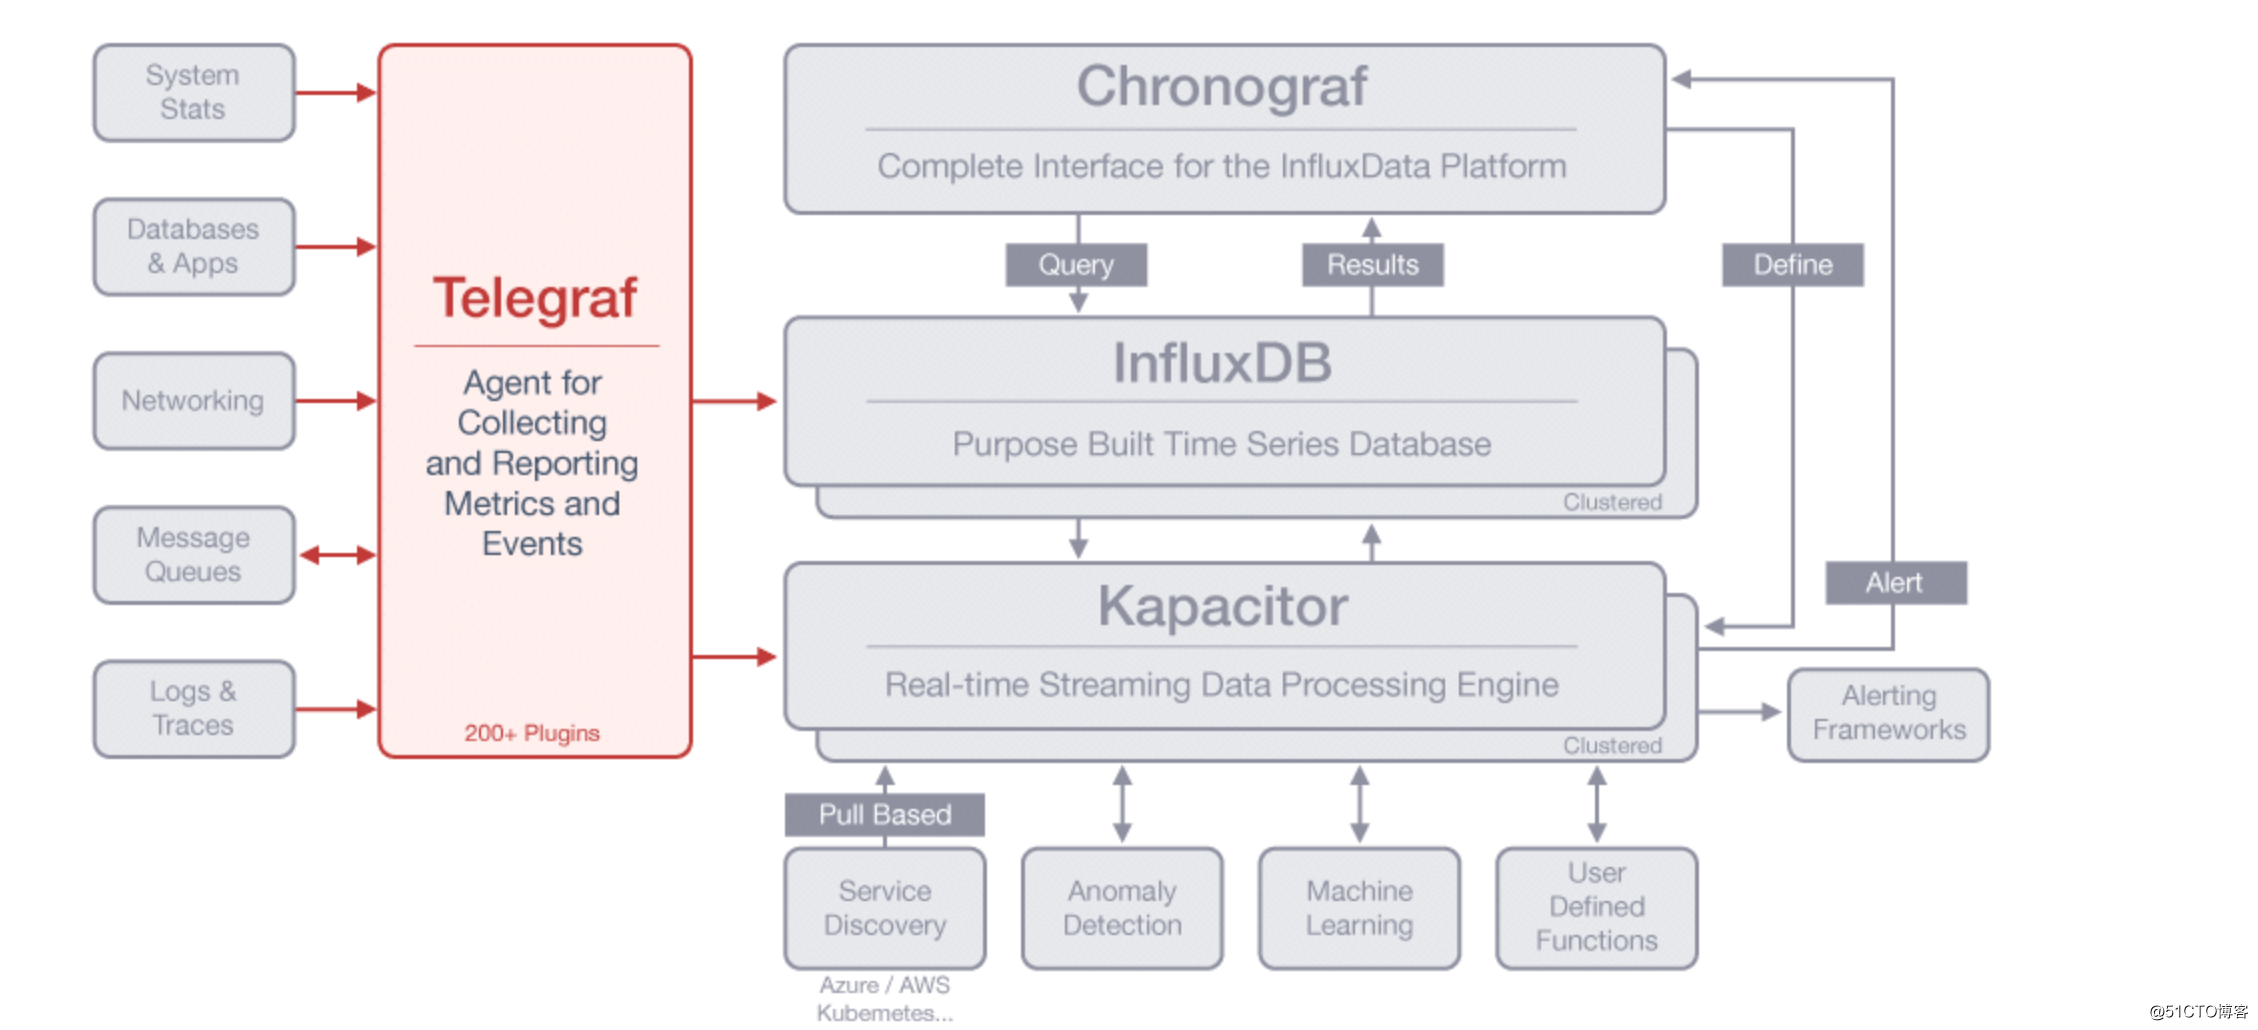
三、数据存储之InfluxDB
InfluxDB是一个时间序列数据库,旨在处理高写入和查询负载,主要用于存储系统的监控数据
InfluxDB有三大特性:
? Time Series (时间序列):可以使用与时间有关的相关函数(如最大,最小,求和等)
? Metrics(度量):你可以实时对大量数据进行计算
? Eevents(事件):它支持任意的事件数据
?
特点
? Schemaless(无结构),可以是任意数量的列
? Scalable(可扩展):min, max, sum, count, mean, median 一系列函数,方便统计
? Native HTTP API, 内置http支持,使用http读写
? Powerful Query Language 类似sql
? 自带压力测试工具等,功能强大
四、数据展示之Grafana
Grafana是一个开源指标分析和可视化套件,常用于可视化基础设施的性能数据和应用程序分析的时间序列数据。也可以应用于其他领域,包括工业传感器,家庭自动化,天气和过程控制。但请注意,我们使用Grafana最关心的是如何把数据进行聚合后进行展示。
Grafana支持多种不同的时序数据库数据源,Grafana对每种数据源提供不同的查询方法,而且能很好的支持每种数据源的特性。它支持下面几种数据源:Graphite、Elasticsearch、CloudWatch、InfluxDB、OpenTSDB、Prometheus、MySQL、Postgres、Microsoft SQL Server (MSSQL)。每种数据源都有相应的文档,可以将多个数据源的数据合并到一个单独的仪表板上。
五、配置监控主机状态及mysql运行状态
5.1、创建数据库
[[email protected] ~]# influx
> create user "mysql-server"with password ‘123456‘
> create database myserverDB
5.2、配置本机的influxdb数据库为期望的输出源-output
[[email protected] ~]# vim /etc/telegraf/telegraf.conf
[[outputs.influxdb]]
urls = ["http://127.0.0.1:8086"]
database = "myserverDB"
5.3、配置监控项-input
配置基本监控项
[[email protected] ~]# cat /etc/telegraf/telegraf.d/telegraf.conf
[[inputs.net]]
interfaces = ["eth0,eth1,lo"]
[[inputs.cpu]]
? ##Whether to report per-cpu stats or not
?percpu = true
? ##Whether to report total system cpu stats or not
?totalcpu = true
? ## Iftrue, collect raw CPU time metrics.
?collect_cpu_time = false
# Read metrics about disk usage by mountpoint
[[inputs.disk]]
? ## Bydefault, telegraf gather stats for all mountpoints.
? ##Setting mountpoints will restrict the stats to the specified mountpoints.
? #mount_points = ["/"]
? ##Ignore some mountpoints by filesystem type. For example (dev)tmpfs (usually
? ##present on /run, /var/run, /dev/shm or /dev).
?ignore_fs = ["tmpfs", "devtmpfs"]
# Read metrics about disk IO by device
[[inputs.diskio]]
[[inputs.kernel]]
[[inputs.mem]]
[[inputs.processes]]
[[inputs.swap]]
[[inputs.system]]
[[inputs.netstat]]
配置mysql监控项
[[email protected] ~]# cat /etc/telegraf/telegraf.d/telegraf_mysql.conf
[[inputs.mysql]]
interval = "5m"
servers = ["tcp(127.0.0.1:3306)/"]
perf_events_statements_digest_text_limit = 120
perf_events_statements_limit = 250
perf_events_statements_time_limit = 86400
table_schema_databases = [""]
gather_table_schema = false
gather_process_list = true
gather_info_schema_auto_inc = true
gather_slave_status = true
gather_binary_logs = false
gather_table_io_waits = false
gather_table_lock_waits = false
gather_index_io_waits = false
gather_event_waits = false
gather_file_events_stats = false
interval_slow = "30m"
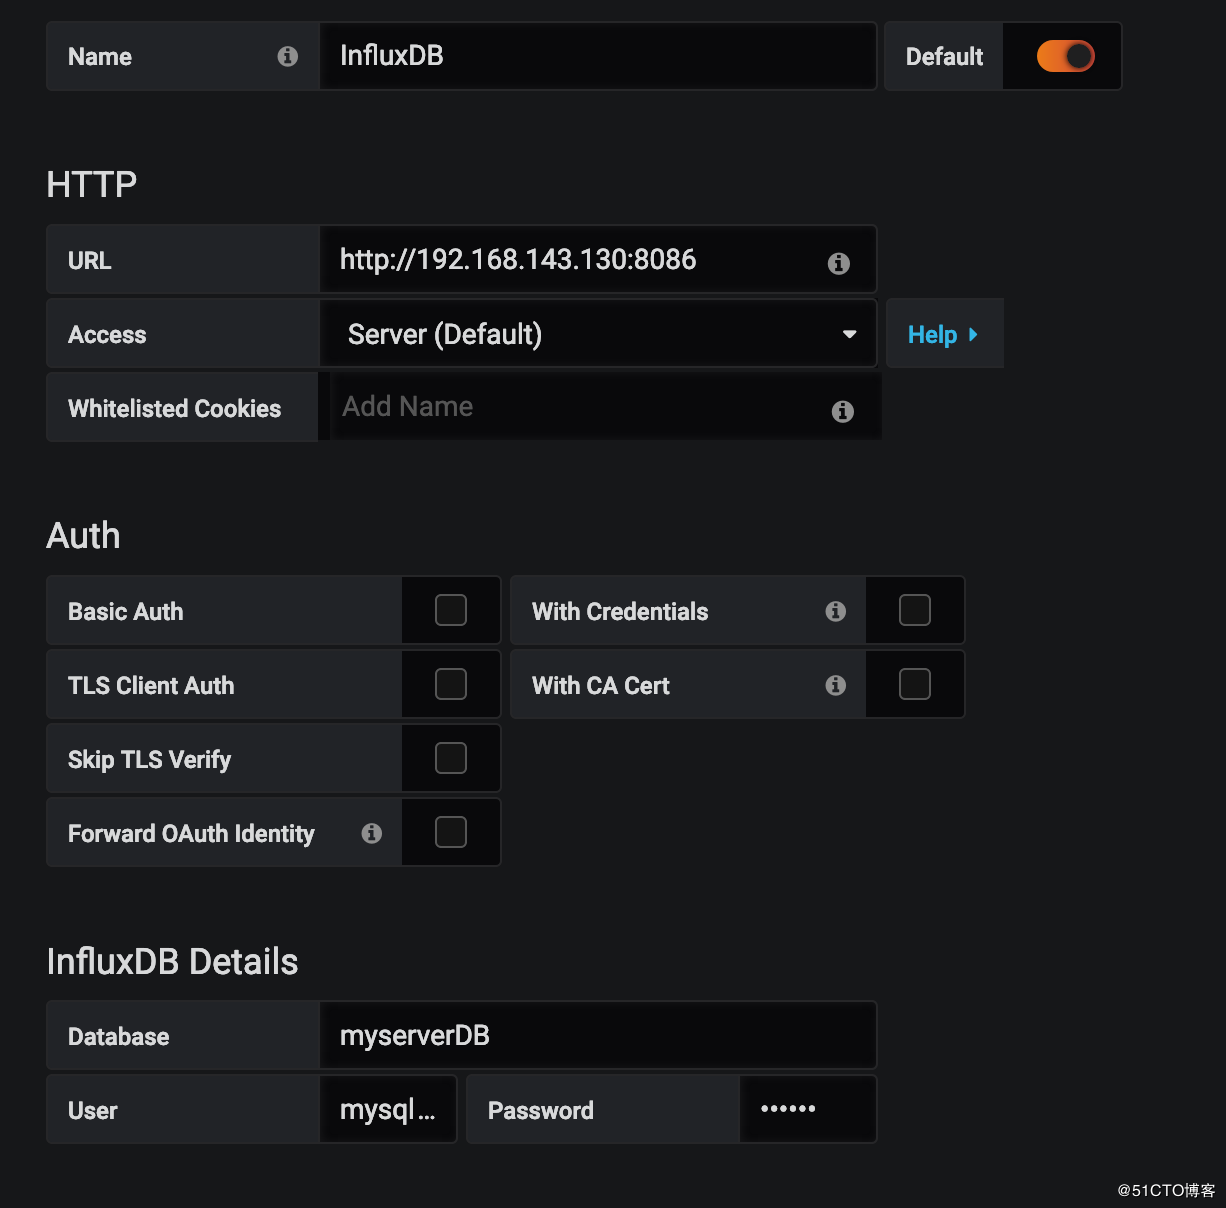
5.4、配置grafana界面
选择Data Sources,添加需要的数据源
创建主机仪表盘
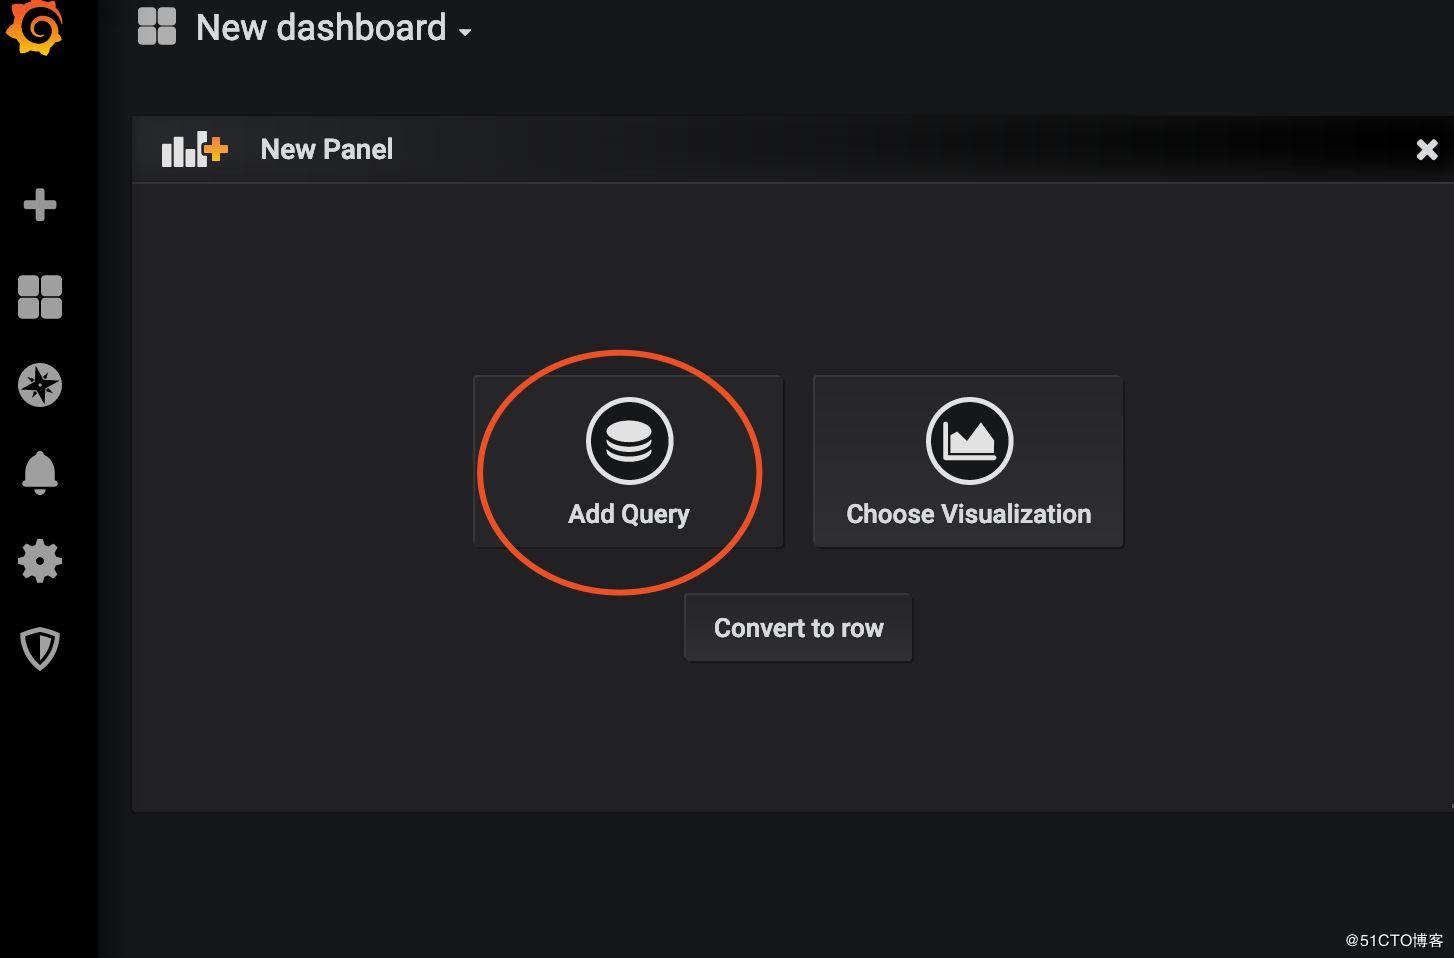
可以通过访问https://grafana.com/dashboards 来查看已经由其他用户共享的仪表盘,选取合适的使用,缩短上手时间
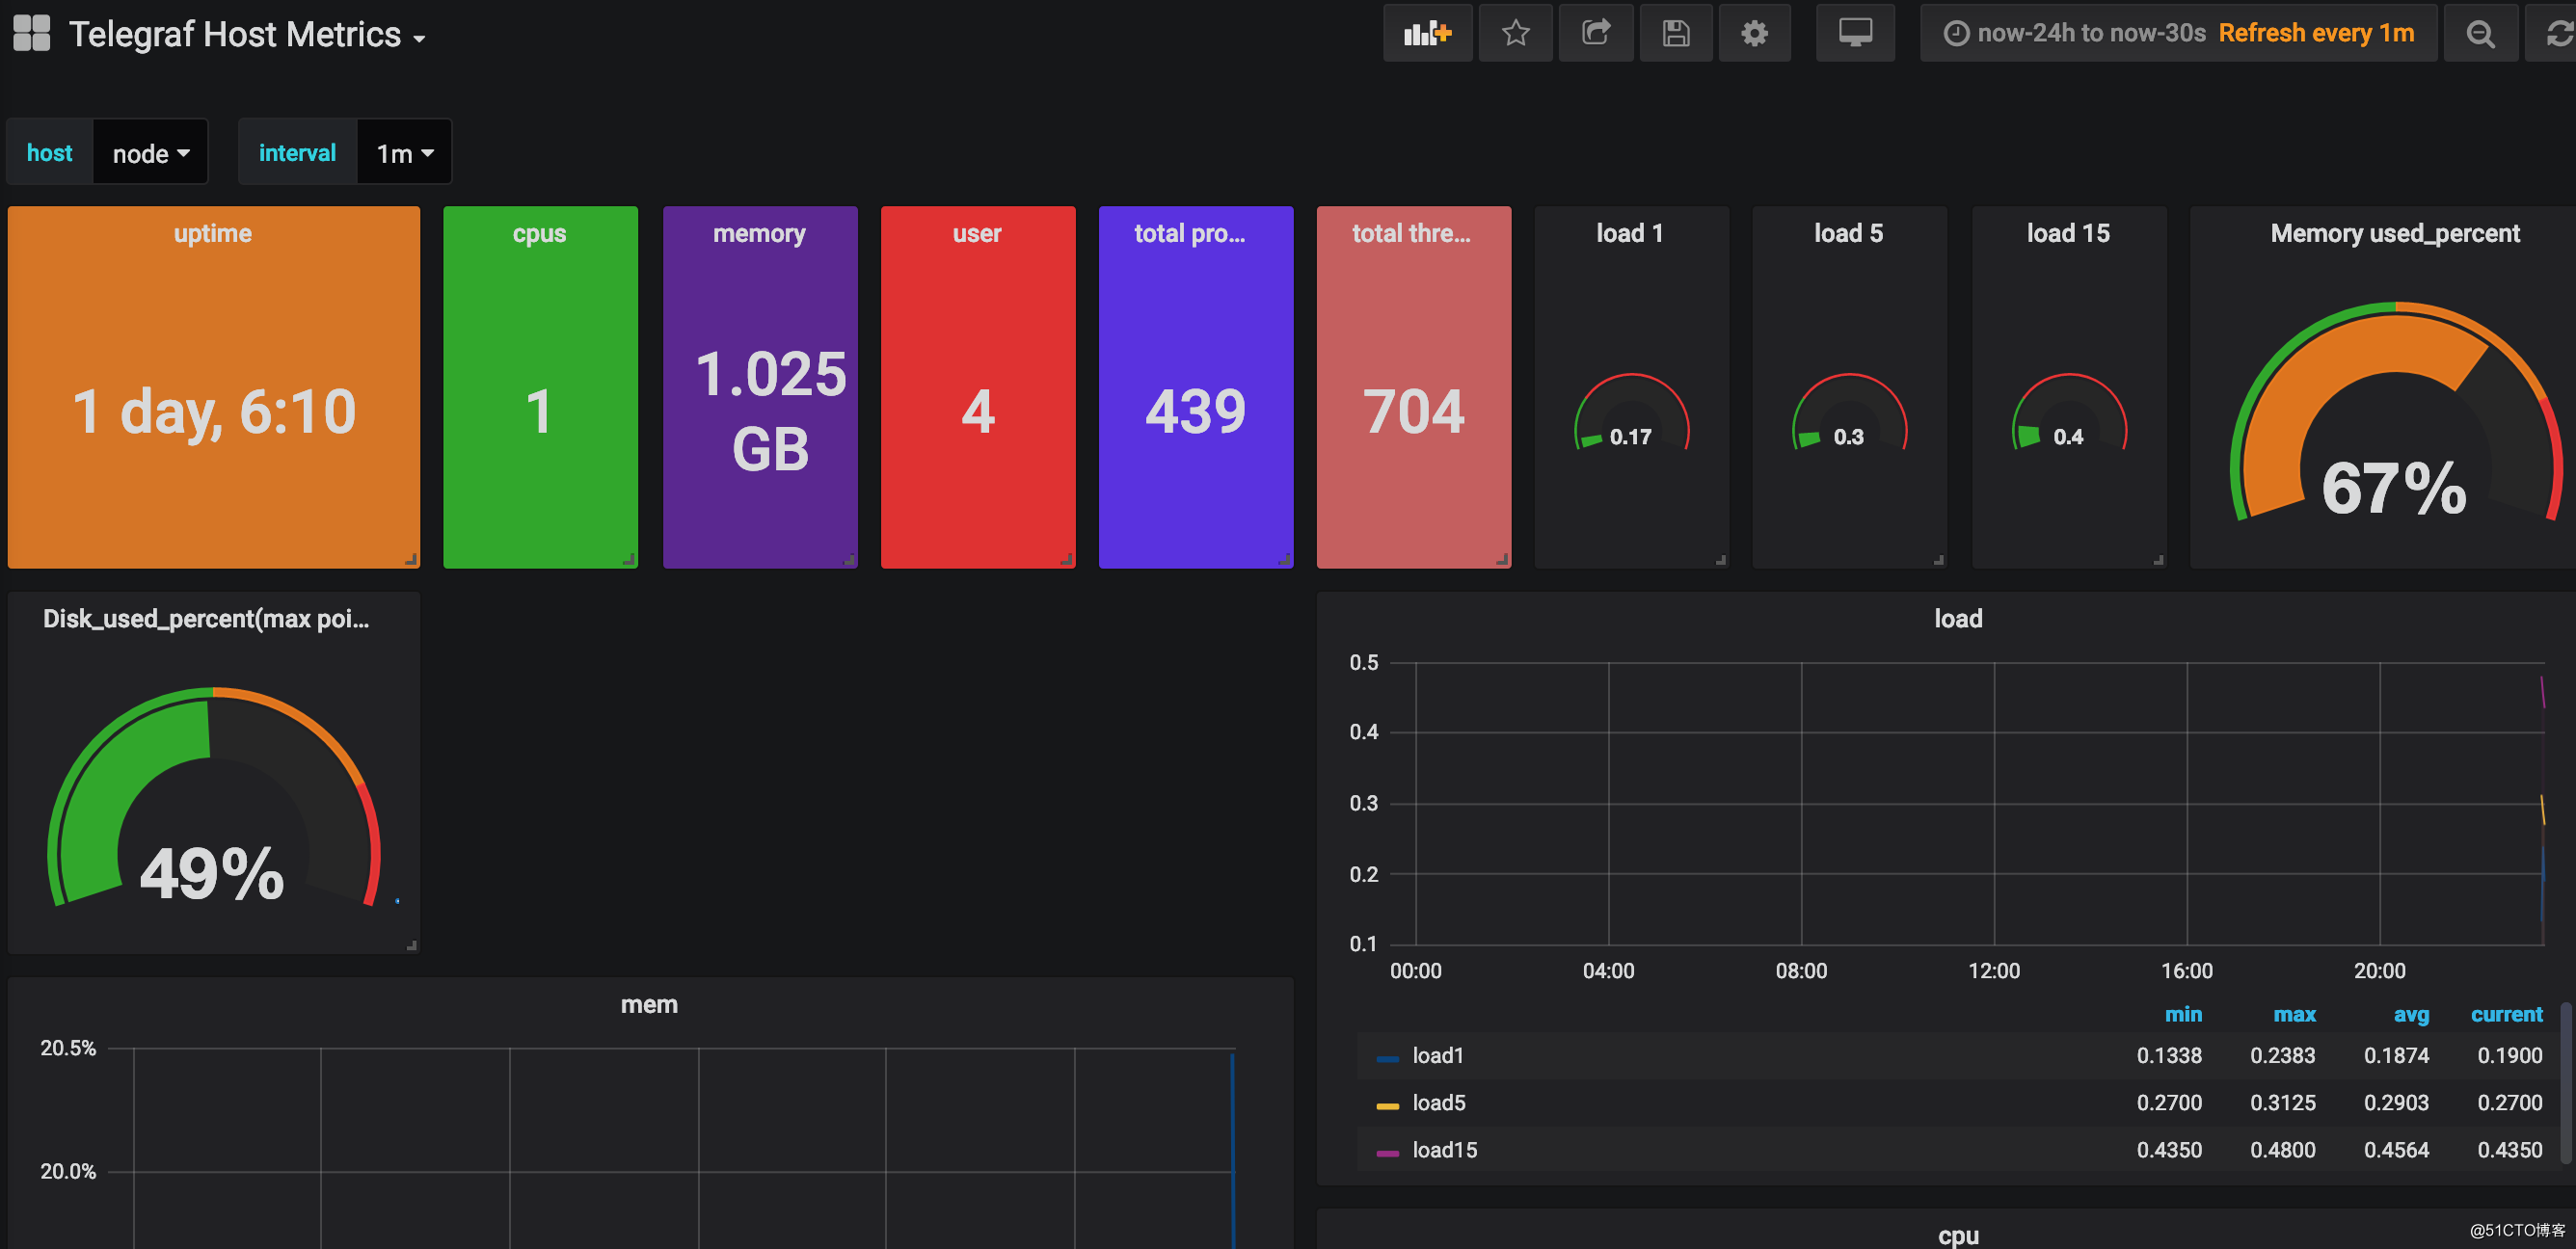
将合适的模版import导入,我这里用的是https://grafana.com/dashboards/1443, 注意模版与telegraf input配置一致。
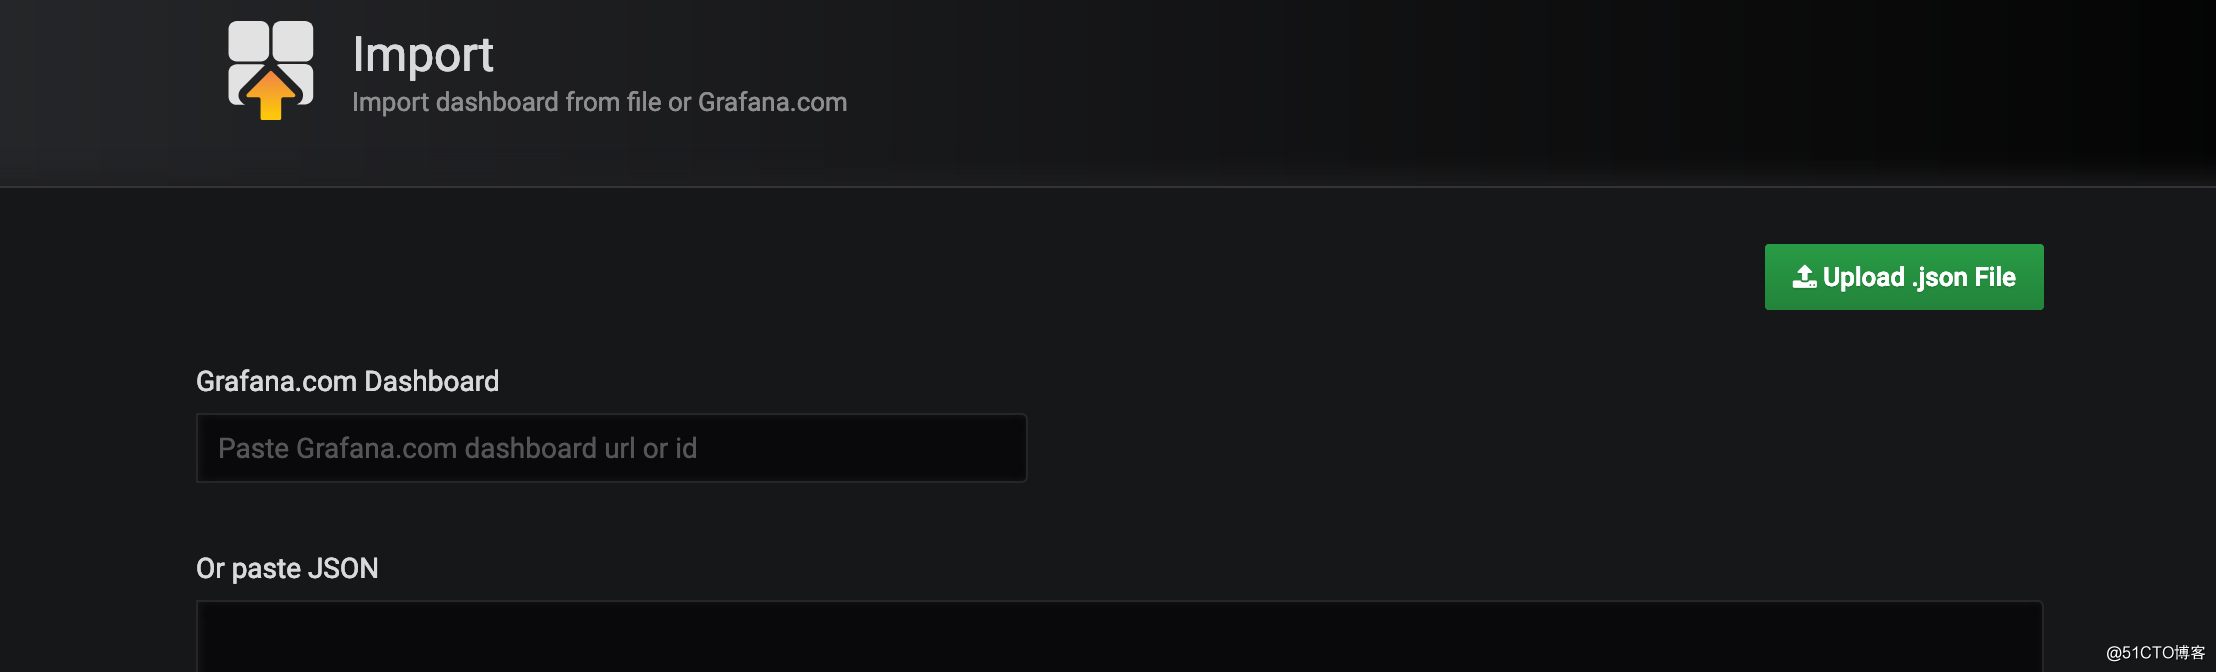
可以看到如下界面
原文:https://blog.51cto.com/jiayimeng/2378086


 194
194


 被折叠的 条评论
为什么被折叠?
被折叠的 条评论
为什么被折叠?
 到【灌水乐园】发言


