


利用pROC包绘制ROC曲线
1 写在前面
- 需要的包为"pROC"、"ggplot2"。如果没有,请安装。
- 使用自带的aSAH数据库,数据库:This dataset summarizes several clinical and one laboratory variable of 113 patients with an aneurysmal subarachnoid hemorrhage.
- pROC包中的缩写:
- ROC: receiver operating characteristic
- AUC: area under the ROC curve
- pAUC: partial AUC
- CI: confidence interval
- SP: specificity
- SE: sensitivity
2 安装拓展包
install.packages("pROC")     # 下载 pROC 包
install.packages("ggplot2")  # 下载 ggplot2 包
3 调用拓展包
library(pROC)      # 加载pROC包
library(ggplot2)  # 调用ggplot2包以利用ggroc函数
4 导入数据
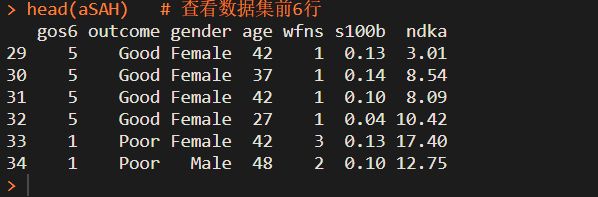
data(aSAH)   # 加载数据集
head(aSAH)   # 查看数据集前6行
5 建立曲线
roc1 # Build a ROC object and compute the AUC
roc2 # Create a few more curves for the next examples
# smooth=TRUE 绘制光滑曲线,默认为F,可省略
 最低0.47元/天 解锁文章


 686
686


 被折叠的 条评论
为什么被折叠?
被折叠的 条评论
为什么被折叠?
 到【灌水乐园】发言


