


 本文介绍了Python的Matplotlib库中pyplot.yscale()函数的使用,该函数用于设置y轴的比例。通过示例展示了如何创建线性、对数和对称对数比例的图表,并提供了绘制logit尺度的代码。
Matplotlib是Python中的一个库,它是NumPy库的数字-数学扩展。 Pyplot是Matplotlib模块的基于状态的接口,该模块提供MATLAB-like接口。
matplotlib.pyplot.yscale() in Python
matplotlib.pyplot.yscale()函数在matplotlib库的pyplot模块中,用于设置y轴比例。
用法: matplotlib.pyplot.yscale(value, **kwargs)
参数:
值= {“linear”,“log”,“symlog”,“logit”,…}
这些是要应用的各种轴刻度。
** kwargs =接受不同的关键字参数,具体取决于比例尺(matplotlib.scale.LinearScale,LogScale,SymmetricalLogScale,LogitScale)
范例1:
Python3
import numpy as np
import pandas as pd
import matplotlib.pyplot as plt
import time
%matplotlib inline
# Example 1
y = np.random.randn(50)
y = y[(y > 0) & (y < 1)]
y.sort()
x = np.arange(len(y))
# plot with various axes scales
plt.figure()
# linear
plt.subplot(221)
plt.plot(x, y)
plt.yscale('linear')
plt.title('linear')
plt.grid(True)
# log
plt.subplot(222)
plt.plot(x, y)
plt.yscale('log')
plt.title('log')
plt.grid(True)
plt.show()
输出:
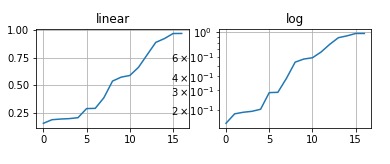
线性和对数的yscale图
范例2:
Python3
import numpy as np
import pandas as pd
import matplotlib.pyplot as plt
import time
%matplotlib inline
# Example 2
# useful for `logit` scale
from matplotlib.ticker import NullFormatter
# Fixing random state for reproducibility
np.random.seed(100)
# make up some data in the
# interval ]0, 1[
y = np.random.normal(loc=0.5,
scale=0.4, size=1000)
y = y[(y > 0) & (y < 1)]
y.sort()
x = np.arange(len(y))
# plot with various axes scales
plt.figure()
# symmetric log
plt.subplot(221)
plt.plot(x, y - y.mean())
plt.yscale('symlog', linthreshy=0.01)
plt.title('symlog')
plt.grid(True)
# logit
plt.subplot(222)
plt.plot(x, y)
plt.yscale('logit')
plt.title('logit')
plt.grid(True)
plt.gca().yaxis.set_minor_formatter(NullFormatter())
# Adjust the subplot layout, because
# the logit one may take more space
# than usual, due to y-tick labels like "1 - 10^{-3}"
plt.subplots_adjust(top=0.80, bottom=0.03,
left=0.15, right=0.92,
hspace=0.34,wspace=0.45)
plt.show()
输出:
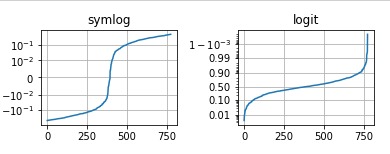
ylog图用于loglog和logit


 被折叠的 条评论
为什么被折叠?
被折叠的 条评论
为什么被折叠?
 到【灌水乐园】发言


