


 本博客介绍了如何在Django中实现统计博客每日阅读量,并展示最近七天的阅读趋势。通过创建ReadDetail模型记录日期和阅读数,使用get_or_create方法确保数据唯一性。利用Highcharts库生成图表展示数据,最终在首页展示图表,实现了数据的可视化。
本部分内容参考B站UP再敲一行代码的Django2教程[1]
第十六课 博客阅读计数统计和显示
在上一节课中我们学习了如何对博客阅读量进行统计,还有一个问题没有解决:没有具体到某一天的统计数据(虽然访问量很低,但是可以通过这个需求了解如何进行统计)。本文将解决这个问题,然后对最近七天访问量进行展示。
1. 统计最近七天博客阅读数
首先我们在read_count/models.py中新建一个ReadDetail类,用于获得博客的阅读量。这里比之前的ReadNum类多增加一个date字段,默认值为当前时间(数据类型为datetime格式)。然后进行数据库迁移操作。
from django.utils import timezone
...

class ReadDetail(models.Model):
    read_num = models.IntegerField(default=0)
    date = models.DateField(default=timezone.now)
    content_type = models.ForeignKey(ContentType, on_delete=models.DO_NOTHING)
    object_id = models.PositiveIntegerField()
    content_object = GenericForeignKey('content_type', 'object_id')
在read_count/admin.py中注册模型:
from .models import ReadNum, ReadDetail
...

@admin.register(ReadDetail)
class ReadDetailAdmin(admin.ModelAdmin):
    list_display = ('date', 'read_num', 'content_object')
打开网页后台,如下图所示:
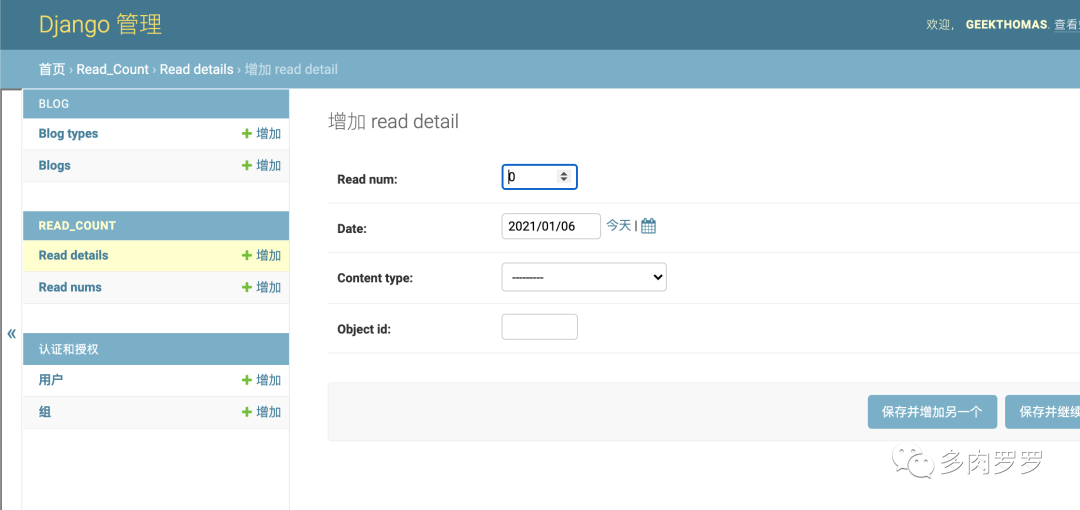
然后我们以第一篇为例进行设置:
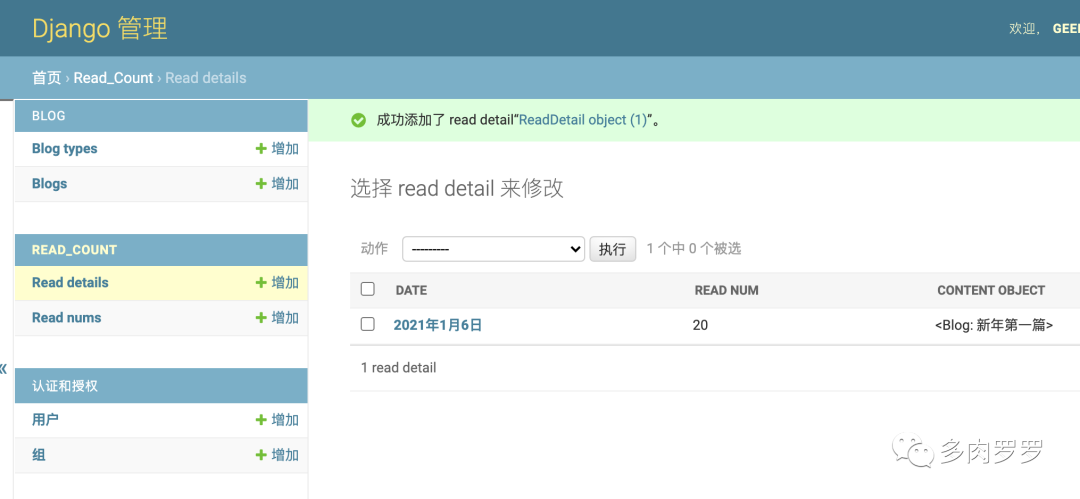
那么怎么记录当天的所有记录呢?比较好的办法是我们可以参照read_count/utlis.py中的写法,当天打开则当天添加一条记录
from django.contrib.contenttypes.models import ContentType
from django.utils import timezone
from .models import ReadNum, ReadDetail

def read_count_once_read(request, obj):
    ct = ContentType.objects.get_for_model(obj)
    key = "%s_%s_read" % (ct.model, obj.pk)
    if not request.COOKIES.get(key):
        ...

        date = timezone.now().date()
        if ReadDetail.objects.filter(content_type=ct, object_id=obj.pk, date=date).count():
            readDetail = ReadDetail.objects.get(content_type=ct, object_id=obj.pk, date=date)
        else:
            readDetail = ReadDetail(content_type=ct, object_id=obj.pk, date=date)

        readDetail.read_num += 1
        readDetail.save()

    return key
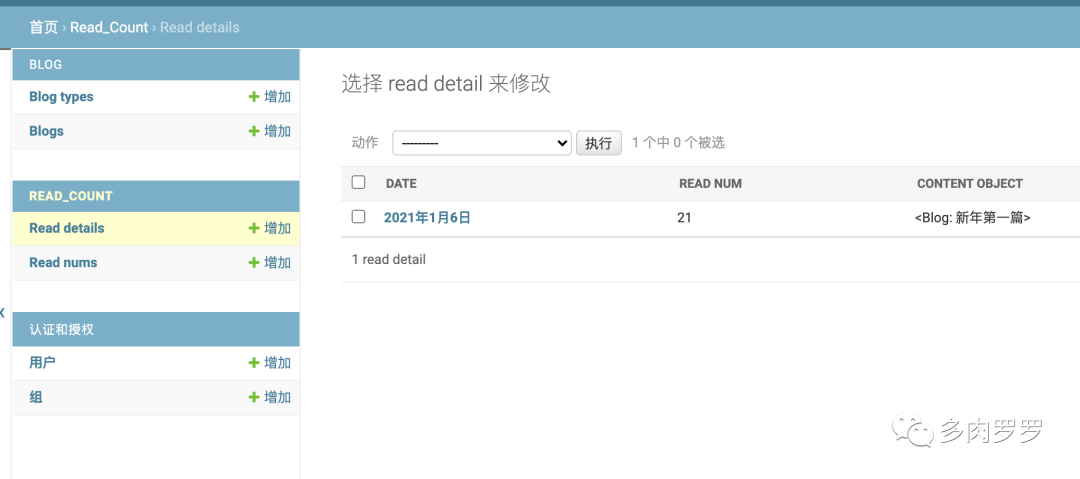
可以试一下:访问第一条博客,会发现总阅读数+1,同时刷新后台,可以看到该文章当日访问量+1
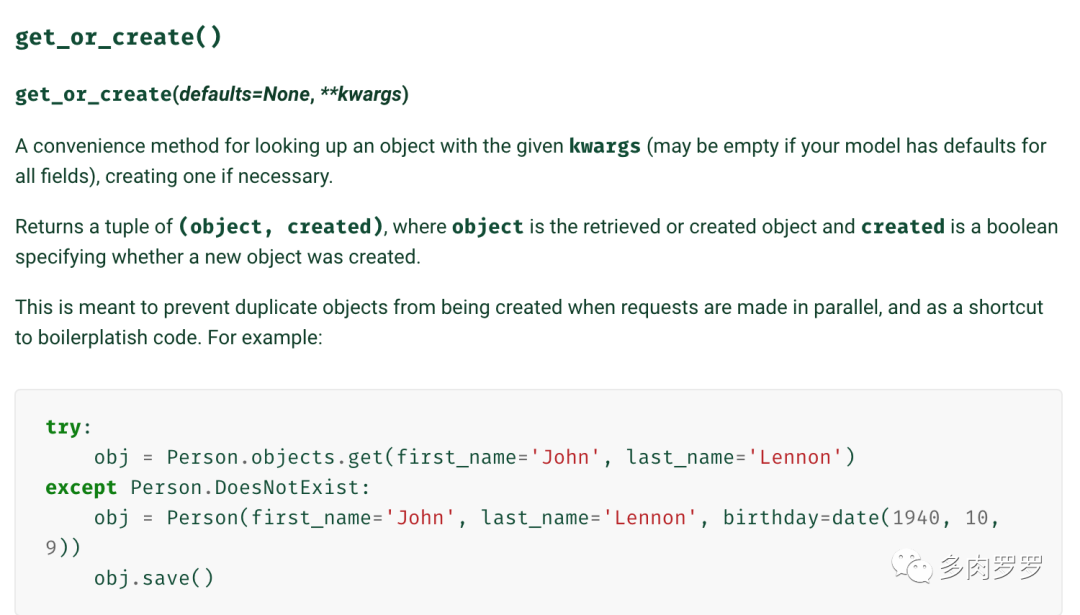
这部分代码的逻辑是:获取想要的记录,如果不存在则创建。Django中给我们提供了类似的接口get_or_create,传入参数,如果没有记录就新建记录,返回元组。
使用这个函数可以改写read_count_once_read方法
def read_count_once_read(request, obj):
    ct = ContentType.objects.get_for_model(obj)
    key = "%s_%s_read" % (ct.model, obj.pk)
    if not request.COOKIES.get(key):
        # 总阅读数+1
        readnum, created = ReadNum.objects.get_or_create(content_type=ct, object_id=obj.pk)
        readnum.read_num += 1
        readnum.save()

        # 当天阅读数+1
        date = timezone.now().date()
        readDetail, created = ReadDetail.objects.get_or_create(content_type=ct, object_id=obj.pk,
            date=date)

        readDetail.read_num += 1
        readDetail.save()

    return key
我们在这里写一个方法:根据当前日期,往前推6天,获得最近七天每天的阅读总量。
>>> from django.db.models import Sum
>>> from read_count.models import ReadDetail
>>> rds = ReadDetail.objects.all()
>>> dir(rds)
[..., 'aggregate', ...]
>>>rds.aggregate(read_num_sum=Sum('read_num'))
{'read_num_sum': 22}
>>>
我们使用filter获得每天的阅读量,然后使用aggregate对read_sum字段进行加总,返回的是一个字典。定义一个get_seven_days_read_data,为了read_count应用更加广泛,这里传入一个content_type参数。为了后面画图显示,我们还传入了一个字符型的时间列表。
def get_seven_days_read_data(content_type):
   today = timezone.now.date()
    dates = []
    read_nums = []
    for i in range(6, -1, -1):
        date = today - datetime.timedelta(days=i)
        read_details = ReadDetail.objects.filter(content_type=content_type, date=date)
        result =read_details.aggregate(read_num_sum = Sum('read_num'))
        read_nums.append(result['read_num_sum'] or 0)
        dates.append(date.strftime('%Y/%m/%d'))
    return dates, read_nums
2. 显示阅读量
我们选择在首页显示阅读量,在全局的views.py中修改home方法,传入dates和read_nums字段
from django.shortcuts import render
from django.contrib.contenttypes.models import ContentType
from read_count.utils import get_seven_days_read_data
from blog.models import Blog

def home(request):
    content_type = ContentType.objects.get_for_model(Blog)
    dates, read_nums = get_seven_days_read_data(content_type=content_type)
    context = {}
    context['dates'] = dates
    context['read_nums'] = read_nums
    return render(request, "home.html", context)
然后在home.html中引用模版标签
{% extends "base.html" %}
{% load static %}
{% block title %}
我的网站|首页
{% endblock %}
{% block header_extends %}
<link rel="stylesheet" type="text/css" href="{% static 'home.css' %}">
{% endblock %}
{% block nav_home_active %}active{% endblock %}}
{% block content%}
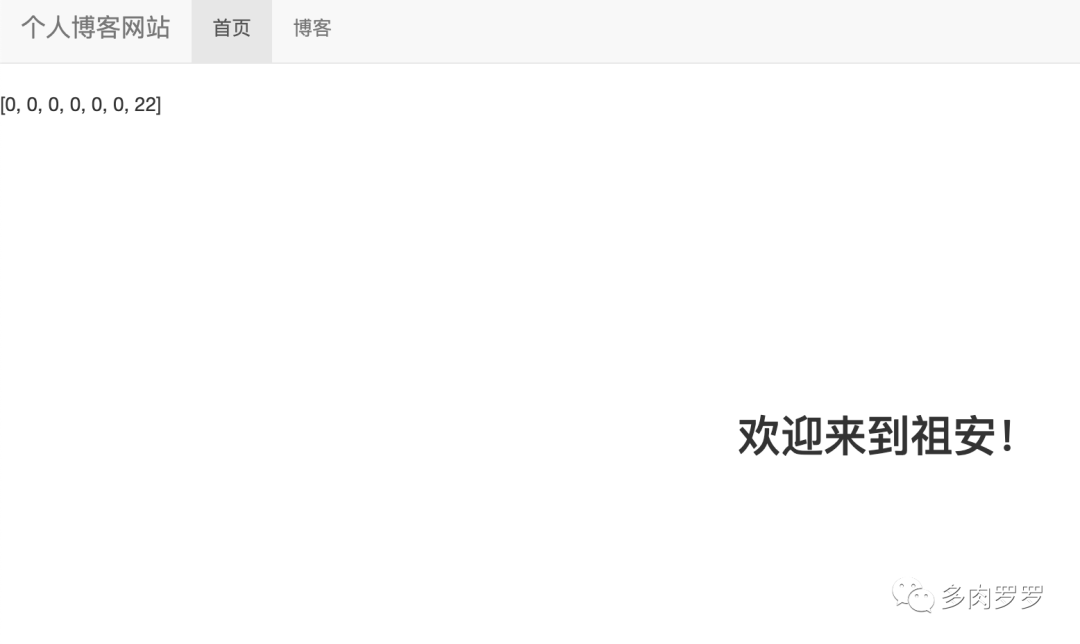
<h3 class="home-content">欢迎来到祖安!h3>
{{ read_nums }}
{% endblock %}
刷新首页可以看到列表显示的read_nums。
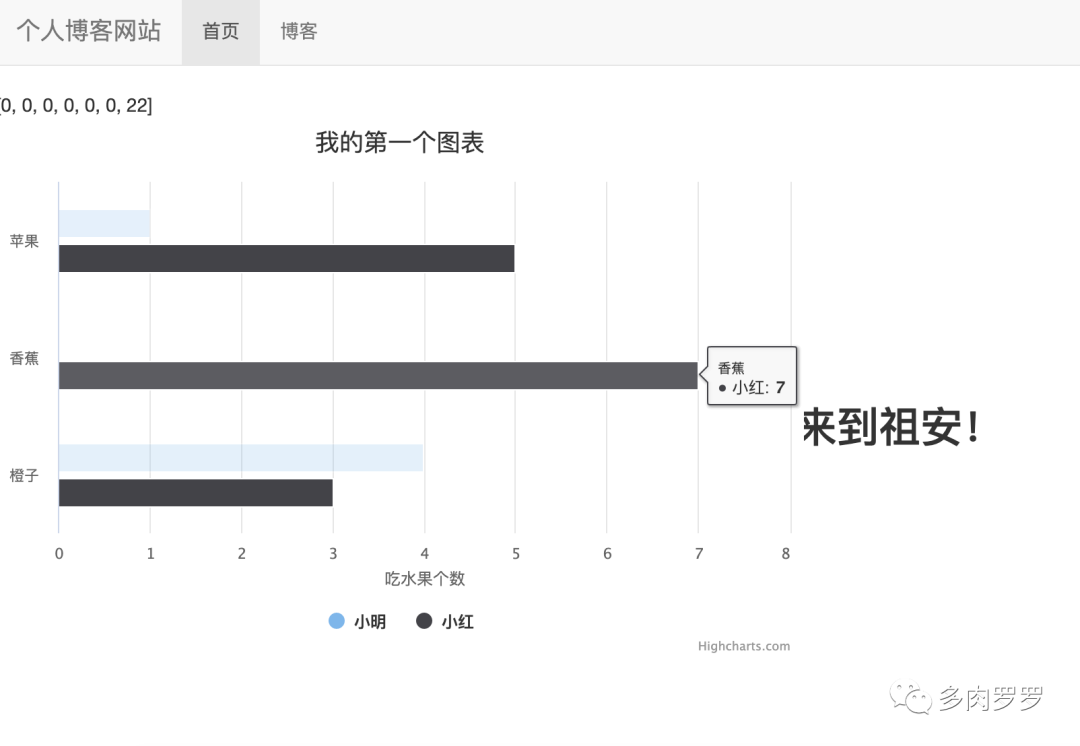
在前端使用数据时,可以使用第三方插件。教程中使用的是Highcharts,我们先尝试使用这个。打开官方文档(有中文文档),然后点击文档教程-使用教程,可以看到有提供一个实例,我们复制实例中的js代码到home.html中。
{% extends "base.html" %}
{% load static %}

{% block title %}
    我的网站|首页
{% endblock %}


{% block header_extends %}
    "stylesheet" type="text/css" href="{% static 'home.css' %}">
{% endblock %}

{% block nav_home_active %}active{% endblock %}}

{% block content%}
class="home-content">欢迎来到祖安!h3>
    {{ read_nums }}
    <div id="container" style="width: 600px;height:400px;">
class="home-content">欢迎来到祖安!h3>
{{ read_nums }}
<div id="container" style="width: 600px;height:400px;">{% endblock %}
刷新后首页显示如下:
我们可以着手修改这一部分js代码以适应我们的显示图表。
{% block content%}
    <h3 class="home-content">欢迎来到祖安!h3>
    <div id="container" style="width: 600px;height:400px;">div>
    <script src="http://code.highcharts.com/highcharts.src.js">script>
    <script>// 图表配置
        Highcharts.chart
        ('container',
            {chart: {type: 'line'                          //指定图表的类型,默认是折线图(line)
                },title: {text: null                 // 标题
                },xAxis: {categories: {{ dates|safe }},   // x 轴分类tickmarkPlacement: 'on',
                },yAxis: {title: { text: null },               // y 轴标题labels: { enabled: false },gridLineDashStyle: 'Dash',
                },series: [{                              // 数据列name: '阅读量',                        // 数据列名data: {{ read_nums }}                    // 数据
                }],plotOptions: {line: {dataLabels: {enabled: true
                        }
                    }
                },legend: { enabled: false },credits: { enabled: false },
            });script>
{% endblock %}
显示效果如下:
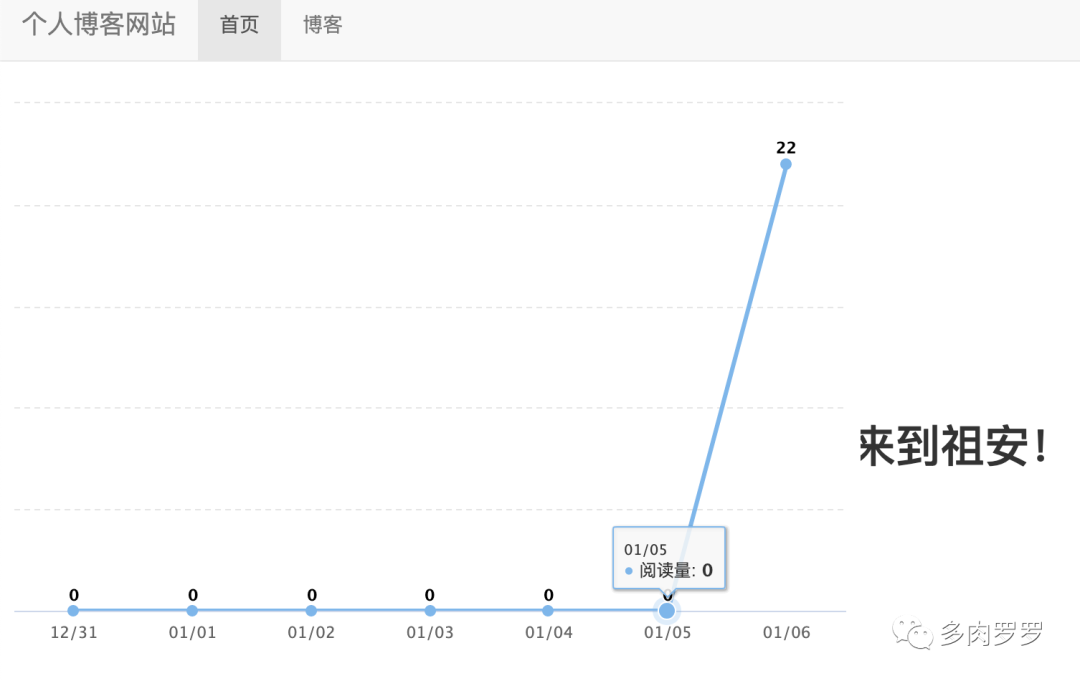
图表能够正确显示。我们再调整一下首页部分的CSS。打开home.css
h3.home-content {
    font-size: 222%;
    text-align: center;
    margin-top: 4em;
    margin-bottom: 2em;
}

div#container {
    margin: 0 auto;
    height: 20em;
    min-width: 20em;
    max-width: 30em;
}
最终首页效果如下:
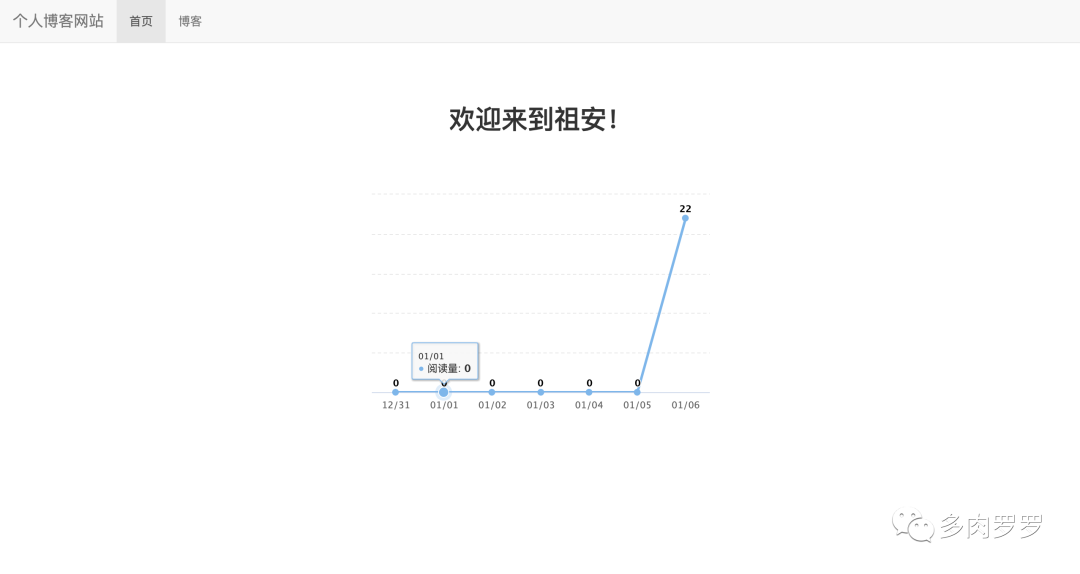
以上就是本文的全部内容。博客阅读数这部分内容较多,原视频是三节课,我这里整合成了两节课。在使用Highcharts时也有遇到一些问题,希望能给后来者提供帮助。下一节课将继续讨论热门博客排行及缓存提速。
参考资料
[1]Django2教程: https://space.bilibili.com/252028233


 1万+
1万+

 被折叠的 条评论
为什么被折叠?
被折叠的 条评论
为什么被折叠?
 到【灌水乐园】发言


