


目录
1、matplotlib有哪些绘图风格
2、绘图风格使用
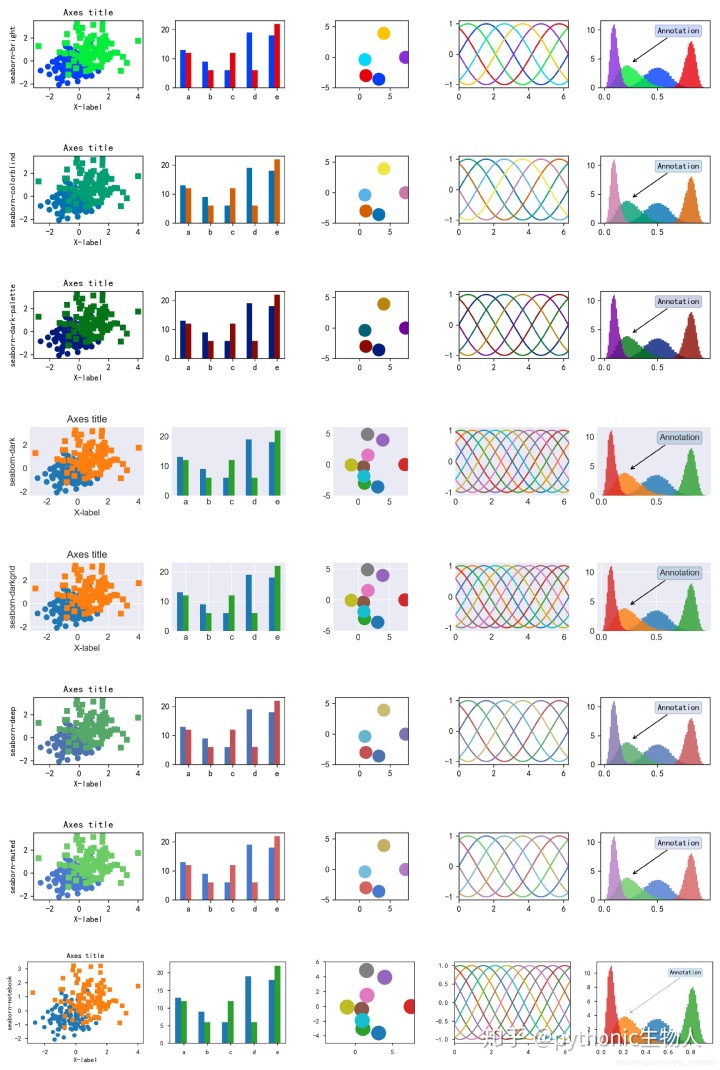
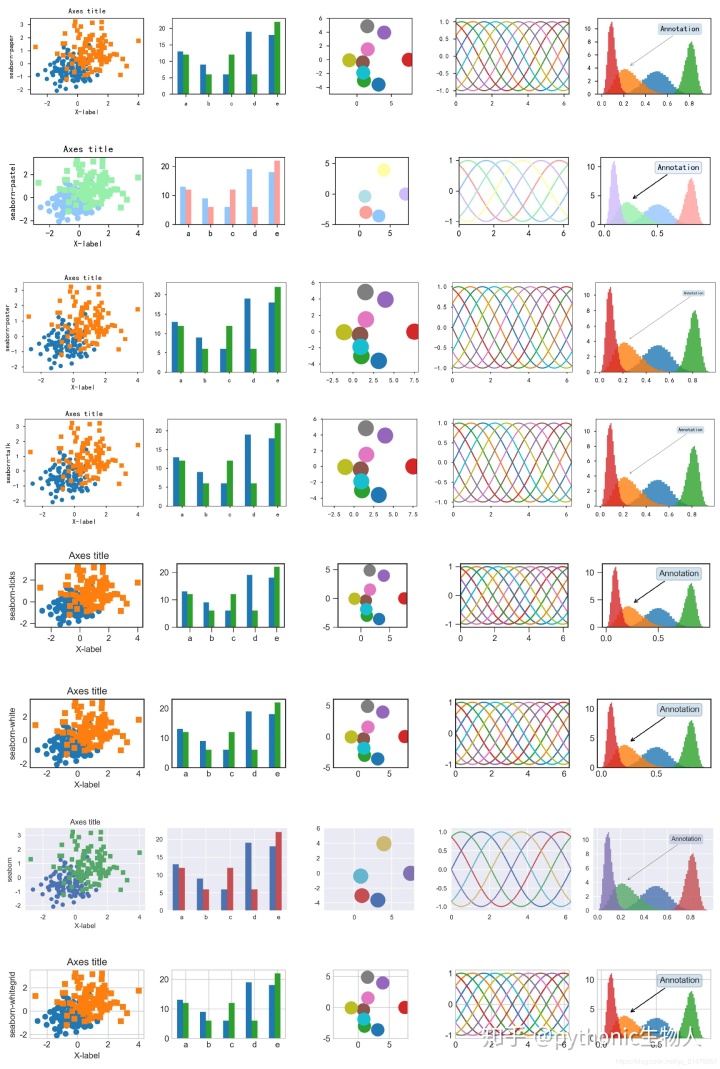
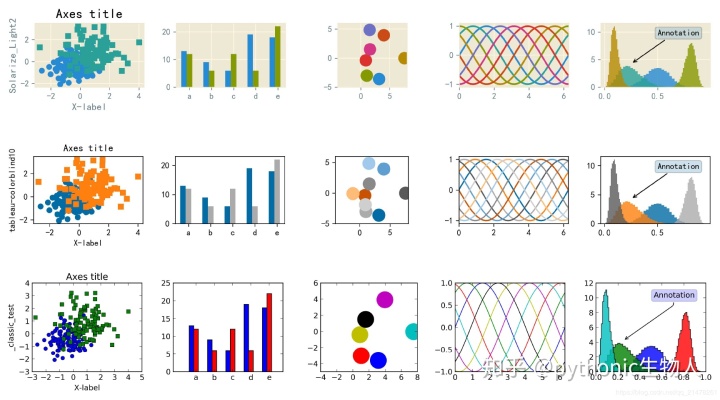
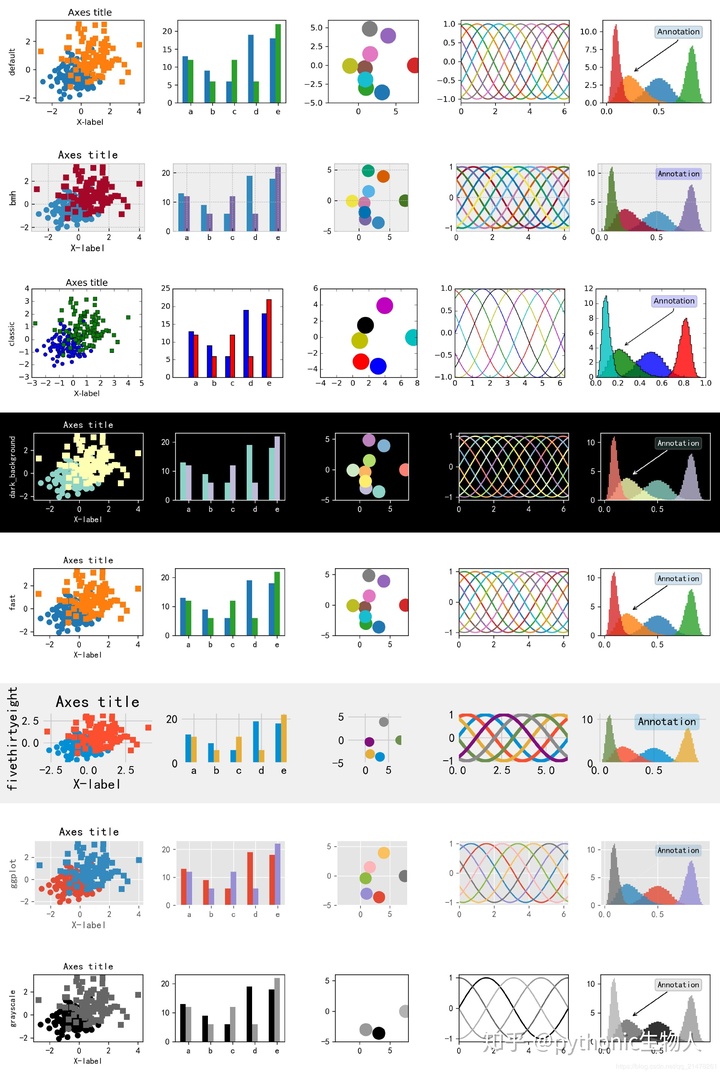
3、26种风格效果是什么样子的
4、参考资料
欢迎随缘关注@pythonic生物人
1、matplotlib有哪些绘图风格
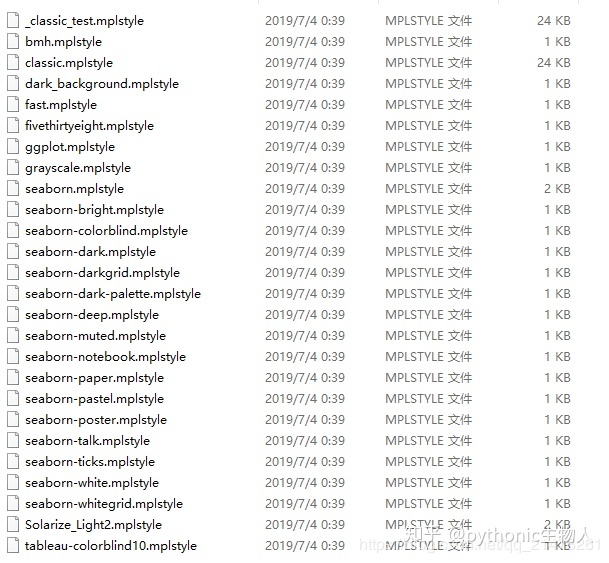
使用plt.style.available输出所有风格名称,共计26种。
import matplotlib.pyplot as plt
 print(plt.style.available)
['bmh', 'classic', 'dark_background', 'fast', 'fivethirtyeight', 'ggplot', 'grayscale', 'seaborn-bright', 'seaborn-colorblind', 'seaborn-dark-palette', 'seaborn-dark', 'seaborn-darkgrid', 'seaborn-deep', 'seaborn-muted', 'seaborn-notebook', 'seaborn-paper', 'seaborn-pastel', 'seaborn-poster', 'seaborn-talk', 'seaborn-ticks', 'seaborn-white', 'seaborn-whitegrid', 'seaborn', 'Solarize_Light2', 'tableau-colorblind10', '_classic_test']
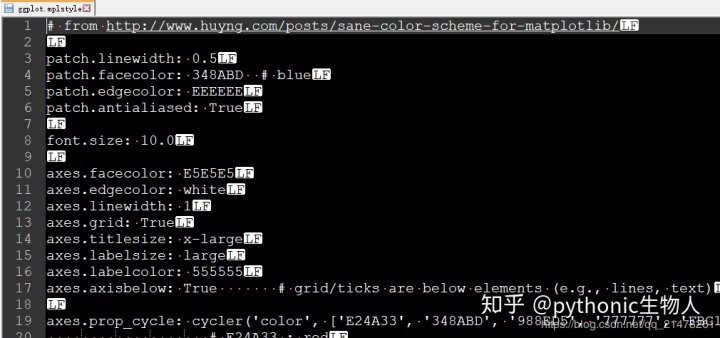
每种风格的源码都在路径xxLibsite-packagesmatplotlibmpl-datastylelib之下,您可以模仿着自定义一个自己的风格,这很简单。
点开一个ggplot的绘图风格看看 ,里面都是线型,颜色等的设置。
2、 绘图风格使用
例如,使用ggplot风格。
plt.style.use('ggplot')3、26种风格效果是什么样子的
4、参考资料
https:// matplotlib.org/gallery/ style_sheets/style_sheets_reference.html#sphx-glr-gallery-style-sheets-style-sheets-reference-py
欢迎随缘关注@pythonic生物人


 3273
3273


 被折叠的 条评论
为什么被折叠?
被折叠的 条评论
为什么被折叠?
 到【灌水乐园】发言


