


![]()
star2883
不是非常明白楼主的意思。我的理解是:
问题1:为什么中间两幅图,显示的都是空白?
答:你是指Figure2和Figure3的显示中,全是白色吗?这个是因为你用了colormap(map)。如果换成colormap(gray),那就有灰度图的显示了。
问题2:没有图了?
答:如果你的意思是跟上一个问题一样,那么按照上一个步骤都换成colormap(gray),那就解决了。但是,我发现你程序还有一段小错误导致 “没有图了?”
wname='db2';
[cA,cH,cV,cD] = dwt2(M,wname);
figure;
subplot(321); image(M); colormap(map); title('原始图像');
subplot(321); image(cA); colormap(map); title('低频系数图像');
subplot(322); image(cH); colormap(map); title('水平高频系数图像');
subplot(323); image(cV); colormap(map); title('垂直高频系数图像');
subplot(324); image(cD); colormap(map); title('对角线高频系数图像');
这里subplot(32 是指3行2列,也就是6张图,你的编号应该参考下一段进行修改,
subplot(321); image(M); colormap(map); title('原始图像');
subplot(322); image(cA); colormap(map); title('低频系数图像');
subplot(323); image(cH); colormap(map); title('水平高频系数图像');
subplot(324); image(cV); colormap(map); title('垂直高频系数图像');
subplot(325); image(cD); colormap(map); title('对角线高频系数图像');
否则Figure2中 '原始图像' 漏掉了。
另外,运用matlab时主要的老师就是该软件提供的帮助,基本每个函数都要说明和案例。不知道我说的有没有用。

skevin000
一:
因为cA,cH,... 是 double 型 变量,变换范围不是image默认的,用imshow 或image前,在workplace里看下cA,cH,...的范围
楼主可以尝试这样用,这个最方便:
figure,imhsow(cA,[]) ,title("低频图像的系数");
% 其中 imshow参数内的[] 表示输出的范围
%具体的用命令 doc imshow 看详细介绍
二:
楼主贴出的 subplot用法,有点小问题,出现了图像覆盖的现象,两个subplot(321)了
subplot(321); image(M); colormap(map); title('原始图像');
subplot(321); image(cA); colormap(map); title('低频系数图像');

Allen2014
引用回帖:
star2883 at 2012-11-17 14:49:41
不是非常明白楼主的意思。我的理解是:
问题1:为什么中间两幅图,显示的都是空白?
答:你是指Figure2和Figure3的显示中,全是白色吗?这个是因为你用了colormap(map)。如果换成colormap(gray),那就有灰度图的显 ...
首先,谢谢您能热心对我的问题进行斧正,使我对自己的错误有了认识和改进!但是我还有些问题想请教您,希望能得道您的指点,谢谢!
1、下面是我按照您的建议修改后的算法:
clear;
clc;
%第一部分:添加高斯噪声并显示图像
[Y,map]=imread('hehua.jpg');
figure,subplot(131),imshow(Y),title('原始图像');%显示原图像
X=rgb2gray(Y);%转化为灰度图像
subplot(132),imshow(X),title('灰度图像');%显示灰度图像
% 生成含噪图像并显示
% X=double(X);
M=imnoise(X,'gaussian',0,0.01);%添加均值为0,方差为0.01的高斯白噪声
subplot(133),imshow(M),title('高斯噪声图像');%显示含噪图像
wname='db2';
[cA,cH,cV,cD] = dwt2(M,wname);
figure;
subplot(321); image(M); colormap(gray); title('原始图像');
subplot(322); image(cA); colormap(gray); title('低频系数图像');
subplot(323); image(cH); colormap(gray); title('水平高频系数图像');
subplot(324); image(cV); colormap(gray); title('垂直高频系数图像');
subplot(325); image(cD); colormap(gray); title('对角线高频系数图像');
rX = idwt2(cA, cH, cV, cD, wname);
rA = upcoef2('a', cA, wname);
rH = upcoef2('h', cH, wname);
rV = upcoef2('v', cV, wname);
rD = upcoef2('d', cD, wname);
figure;
subplot(321); image(M); colormap(gray); title('原始图像');
subplot(322); image(rX); colormap(gray); title('重构图像');
subplot(323); image(rA); colormap(gray); title('低频系数直接重构图像');
subplot(324); image(rH); colormap(gray); title('水平高频系数直接重构图像');
subplot(325); image(rV); colormap(gray); title('垂直高频系数直接重构图像');
subplot(326); image(rD); colormap(gray); title('对角线高频系数直接重构图像');
2、下面figure1——figure3是修改算法运行后显示的图像。
下面是我的一些问题:
3、figure2中第一幅图“原始图像”,第二幅“低频系数图像”,为什么那么多白色像素?figure2中的“原始图像”应该是figure1中的第三幅图像,但是不知道为什么运行算法后会这样?figure3中也有同样的问题。
4、能否直接用真彩图像进行小波分解、重构、真彩显示?(我尝试过,但是基本小波分解和重构部分还是什么显示都没有,连图像标题都没有显示)。
谢谢!
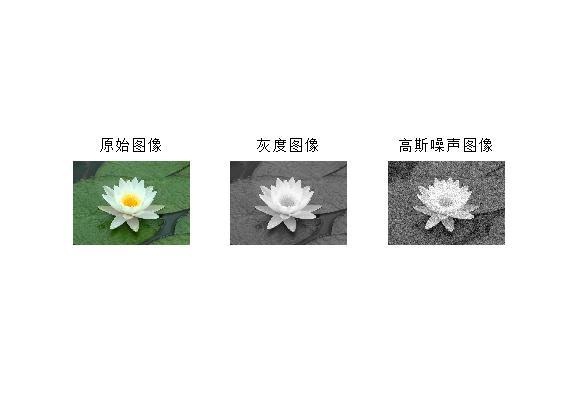
figure1.jpg
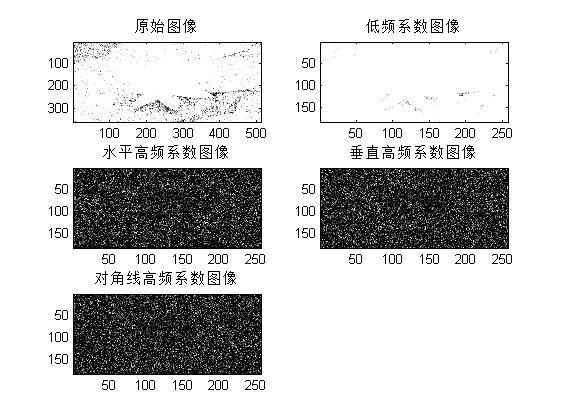
figure2.jpg
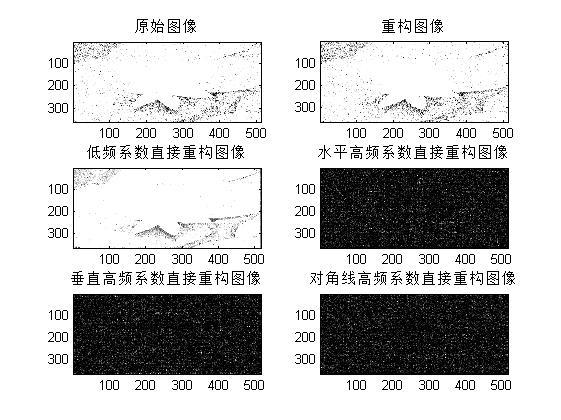
figure3.jpg
Allen2014
引用回帖:
skevin000 at 2012-11-18 11:28:32
一:
因为cA,cH,... 是 double 型 变量,变换范围不是image默认的,用imshow 或image前,在workplace里看下cA,cH,...的范围
楼主可以尝试这样用,这个最方便:
figure,imhsow(cA,[]) ,title("低频图像的 ...
谢谢您的意见!我按照您的意见也进行了算法修改,得到了改善,下面我将我的修改算法运行结果列出来,还有几个问题想请教您,谢谢!
1、修改后的算法:
clear;
clc;
%第一部分:添加高斯噪声并显示图像
[Y,map]=imread('hehua.jpg');
figure,subplot(131),imshow(Y),title('原始图像');%显示原图像
X=rgb2gray(Y);%转化为灰度图像
subplot(132),imshow(X),title('灰度图像');%显示灰度图像
% 生成含噪图像并显示
% X=double(X);
M=imnoise(X,'gaussian',0,0.01);%添加均值为0,方差为0.01的高斯白噪声
subplot(133),imshow(M),title('高斯噪声图像');%显示含噪图像
wname='db2';
[cA,cH,cV,cD] = dwt2(M,wname);
figure;
subplot(321); imshow(Y,[]); title('原始图像');
subplot(322); imshow(cA,[]); title('低频系数图像');
subplot(323); imshow(cH,[]); title('水平高频系数图像');
subplot(324); imshow(cV,[]); title('垂直高频系数图像');
subplot(325); imshow(cD,[]); title('对角线高频系数图像');
rX = idwt2(cA, cH, cV, cD, wname);
rA = upcoef2('a', cA, wname);
rH = upcoef2('h', cH, wname);
rV = upcoef2('v', cV, wname);
rD = upcoef2('d', cD, wname);
figure;
subplot(321); imshow(M,[]); title('原始图像');
subplot(322); imshow(rX,[]); title('重构图像');
subplot(323); imshow(rA,[]); title('低频系数直接重构图像');
subplot(324); imshow(rH,[]); title('水平高频系数直接重构图像');
subplot(325); imshow(rV,[]); title('垂直高频系数直接重构图像');
subplot(326); imshow(rD,[]); title('对角线高频系数直接重构图像');
2、下面是修改算法运行后的图(figure1——figure4):
3、我的问题:
(1)您指出的double和uint8,我通过workspace,发现:输入真彩图像和灰度图像、加噪图像都是uint8型,小波分解后的低频和高频系数都是double型,难道需要在小波分解之前(加噪处理之后)就要先转换成double型吗?小波重构后显示重构图像是否需要再转换成uint8型?
(2)imshow(M,[]),改动后,有灰度图像显示,这个函数是不是要显示uint8型数据图像?
(3)我把算法中的rgb2gray算法去噪,我想让figure1——figure4都显示彩色图像,但是显示有问题,算法运行后图像分别为figure5——figure7;怎么样才能彩色显示?我想看的更直观些。
谢谢!
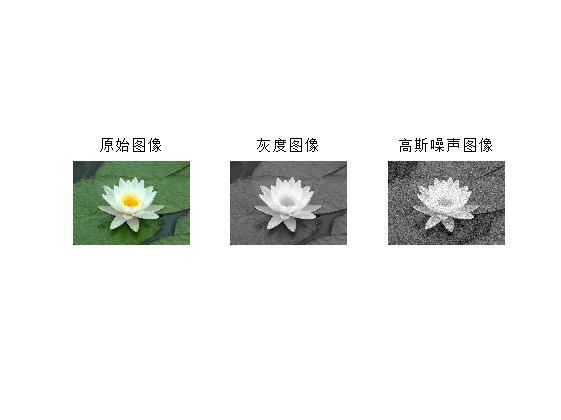
figure1.jpg
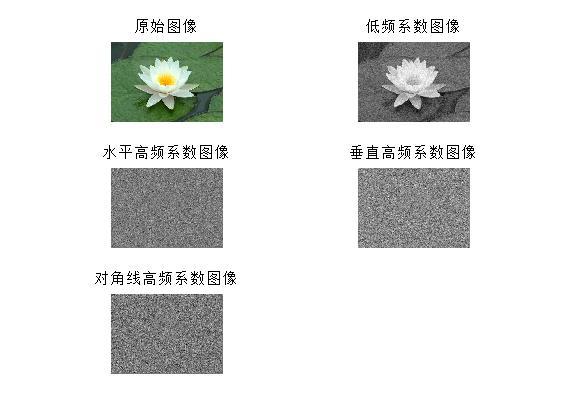
figure2.jpg
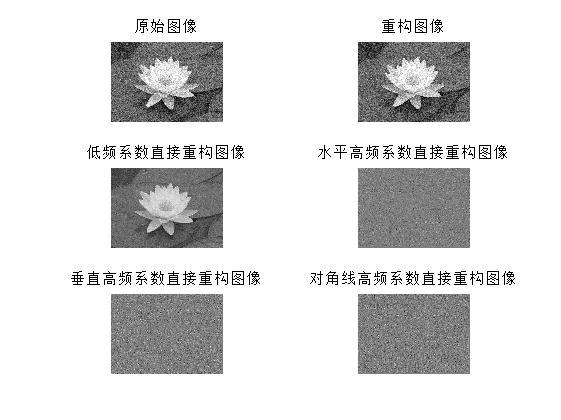
figure3.jpg
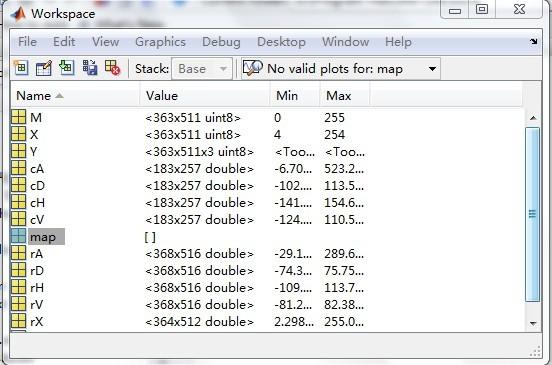
figure4.jpg
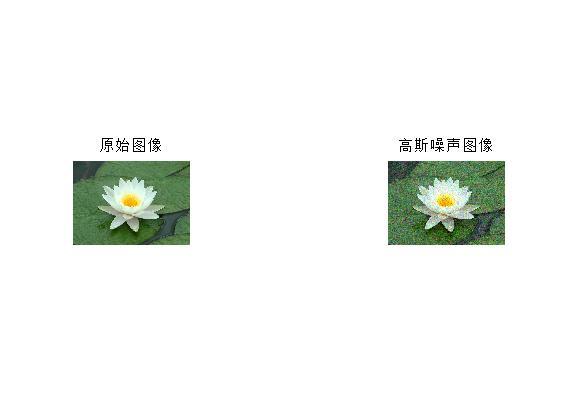
figure5.jpg
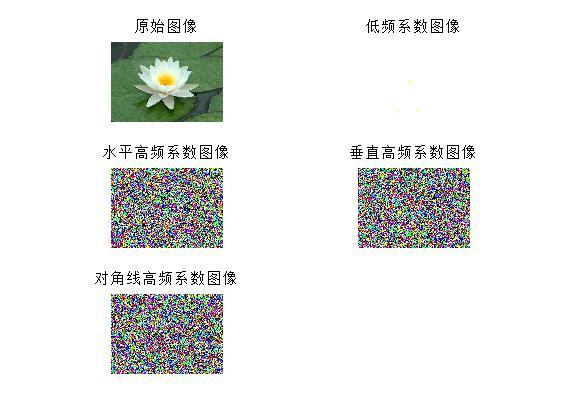
figure6.jpg
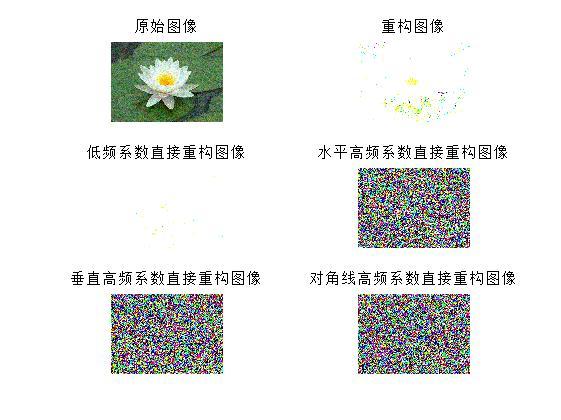
figure7.jpg
,
![]()
star2883
引用回帖:
skevin000 at 2012-11-18 11:28:32
一:
因为cA,cH,... 是 double 型 变量,变换范围不是image默认的,用imshow 或image前,在workplace里看下cA,cH,...的范围
楼主可以尝试这样用,这个最方便:
figure,imhsow(cA,[]) ,title("低频图像的 ...
这位同学,关于你的问题,我建议你查一下matlab下的dwt2函数的帮助,其中包含一个例子应该就是你所想要的。
我贴一段代码,你看了就知道了
dwt2
Purpose
Single-level discrete 2-D wavelet transform
Syntax
[cA,cH,cV,cD] = dwt2(X,'wname')
[cA,cH,cV,cD] = dwt2(X,Lo_D,Hi_D)
Description
The dwt2 command performs a single-level two-dimensional wavelet decomposition with respect to either a particular wavelet ('wname', see wfilters for more information) or particular wavelet decomposition filters (Lo_D and Hi_D) you specify.
[cA,cH,cV,cD] = dwt2(X,'wname') computes the approximation coefficients matrix cA and details coefficients matrices cH, cV, and cD (horizontal, vertical, and diagonal, respectively), obtained by wavelet decomposition of the input matrix X. The 'wname' string contains the wavelet name.
[cA,cH,cV,cD] = dwt2(X,Lo_D,Hi_D) computes the two-dimensional wavelet decomposition as above, based on wavelet decomposition filters that you specify. Lo_D is the decomposition low-pass filter. Hi_D is the decomposition high-pass filter.
Lo_D and Hi_D must be the same length.
Let sx = size(X) and lf = the length of filters; then size(cA) = size(cH) = size(cV) = size(cD) = sa where sa = ceil(sx/2), if the DWT extension mode is set to symmetric padding. For the other extension modes, sa = floor((sx+lf-1)/2).
For information about the different Discrete Wavelet Transform extension modes, see dwtmode.
[cA,cH,cV,cD] = dwt2(...,'mode',MODE) computes the wavelet decomposition with the extension mode MODE that you specify.
MODE is a string containing the desired extension mode.
An example of valid use is
[cA,cH,cV,cD] = dwt2(x,'db1','mode','sym');
Remarks
When X represents an indexed image, then X, as well as the output arrays cA,cH,cV,cD are m-by-n matrices. When X represents a truecolor image, it is an m-by-n-by-3 array, where each m-by-n matrix represents a red, green, or blue color plane concatenated along the third dimension.
For more information on image formats, see the image and imfinfo reference pages.
Examples
% The current extension mode is zero-padding (see dwtmode).
% Load original image.
load woman;
% X contains the loaded image.
% map contains the loaded colormap.
nbcol = size(map,1);
% Perform single-level decomposition
% of X using db1.
[cA1,cH1,cV1,cD1] = dwt2(X,'db1');
% Images coding.
cod_X = wcodemat(X,nbcol);
cod_cA1 = wcodemat(cA1,nbcol);
cod_cH1 = wcodemat(cH1,nbcol);
cod_cV1 = wcodemat(cV1,nbcol);
cod_cD1 = wcodemat(cD1,nbcol);
dec2d = [...
cod_cA1, cod_cH1; ...
cod_cV1, cod_cD1 ...
];
% Using some plotting commands,
% the following figure is generated.
skevin000
引用回帖:
Allen2014 at 2012-11-18 20:10:21
谢谢您的意见!我按照您的意见也进行了算法修改,得到了改善,下面我将我的修改算法运行结果列出来,还有几个问题想请教您,谢谢!
1、修改后的算法:
clear;
clc;
%第一部分:添加高斯噪声并显示图像
=imread ...
回复(个人看法)
(1)小波变换前是要将uint8转换成double型的,如果小波函数内部有自动转换的,也可以不转的。重构之后的double 型可以按照 类似于 [cA/(max(max(cA)))]*255 这样的公式来转换后,在转为uint8,就是最常见的图片的表达方式了0~255,当然也可以转成其它灰度级别的
(2)整形和double的都可以的。imshow(M,[]),的意思将可以理解为将图像灰度的最小值作为灰度0,最大值作为255,就类似于增强了图像的对比度。可能说的不够清楚,看matlab的帮助文档吧 help imshow 或doc imshow
(3)一般彩色图像及部分灰度图像,都是按照RGB(红、绿、蓝)模型来表达色彩的,你如果要对彩色图像进行去噪,我觉得有下面两种方法:1)分别对RGB的三个分量进行滤波,2)将RGB转换为HSI模型,对考虑是分别对是三个分量滤波,还是只对H分量滤波。这些都是很基本的知识,找一本数字图像处理书好好看看吧
Allen2014
引用回帖:
star2883 at 2012-11-18 20:53:45
这位同学,关于你的问题,我建议你查一下matlab下的dwt2函数的帮助,其中包含一个例子应该就是你所想要的。
我贴一段代码,你看了就知道了
dwt2
Purpose
Single-level discrete 2-D wavelet transfo ...
谢谢您!我现在明白了些!


 1231
1231


 被折叠的 条评论
为什么被折叠?
被折叠的 条评论
为什么被折叠?
 到【灌水乐园】发言


