


创建简单的图例
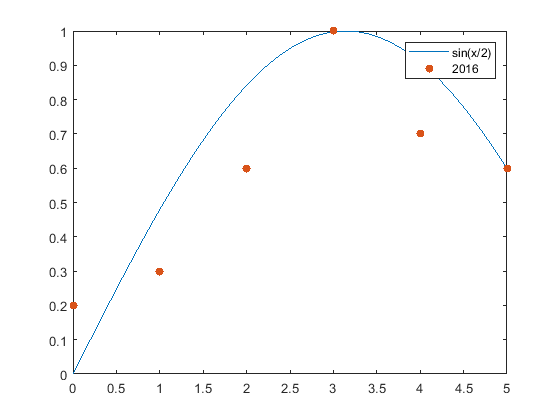
创建一个具有线图和散点图的图窗。为每个图添加具有说明的图例。将图例标签指定为 legend 函数的输入。
figure
x1 = linspace(0,5);
y1 = sin(x1/2);
plot(x1,y1)
hold on
x2 = [0 1 2 3 4 5];
y2 = [0.2 0.3 0.6 1 0.7 0.6];
scatter(x2,y2,'filled')
hold off
legend('sin(x/2)','2016')
使用 DisplayName 指定标签
您也可以使用 DisplayName 属性指定图例标签。调用绘图函数时,将 DisplayName 属性设置为名称-值对组。然后,调用 legend 命令创建图例。
x1 = linspace(0,5);
y1 = sin(x1/2);
plot(x1,y1,'DisplayName','sin(x/2)')
hold on
x2 = [0 1 2 3 4 5];
y2 = [0.2 0.3 0.6 1 0.7 0.6];
scatter(x2,y2,'filled','DisplayName','2016')
 最低0.47元/天 解锁文章


 4918
4918


 被折叠的 条评论
为什么被折叠?
被折叠的 条评论
为什么被折叠?
 到【灌水乐园】发言


