1、引入js
OpenCharts是一个js包,包含了一系列js.只需要引入openchartjs即可
<script type="text/javascript" src="../lib/OpenCharts/OpenCharts.js"></script>
2、html前端书写
前端需要写canvas嵌套在div中摆放位置即可。
<div style="left: 0px; top: 0px; position: absolute;">
<canvas id="canvas1" height="300px" width="500px"></canvas>
</div>
<div style="left: 510px; top: 0px; position: absolute;">
<canvas id="canvas2" height="300px" width="500px"></canvas>
</div>
<div style="left: 1020px; top: 0px; position: absolute;">
<canvas id="canvas3" height="600px" width="500px"></canvas>
</div>
<div style="left:0px;top:330px;position: absolute;">
<canvas id="canvas4" height="400px" width="500px" ></canvas>
</div>
3、js书写
饼状图在angluarjs中书写
| $scope.pieItems = []; $scope.pieChart = {}; $scope.pieInit = function(){ $scope.pieItems.push(new OpenCharts.Item(10,"未知的性别","#838B8B")); $scope.pieItems.push(new OpenCharts.Item(206,"男","#0000CD")); $scope.pieItems.push(new OpenCharts.Item(100,"女","#F00")); $scope.pieItems.push(new OpenCharts.Item(35,"未说明的性别","#FCF6CF")); $scope.pieChart = new OpenCharts.Chart.PieChart("canvas1"); $scope.pieChart.strTitle = "客户的性别分析饼状图"; var message = "${itemName}${itemCaption}性人数为${itemData}人"; $scope.pieChart.addItems($scope.pieItems,"客户的"); $scope.pieChart.addEventListener("mousedown",message); $scope.pieChart.render(); } |
在jqueryjs中书写
| function init() items.push({strCaption : '上海',data : 38.0,itemStyle:'#C0FFFF'}); charts = new OpenCharts.Chart.PieChart("canvas"); var message = "${itemName}${itemCaption}省参赛选手人数为${itemData}人"; charts.render(); |
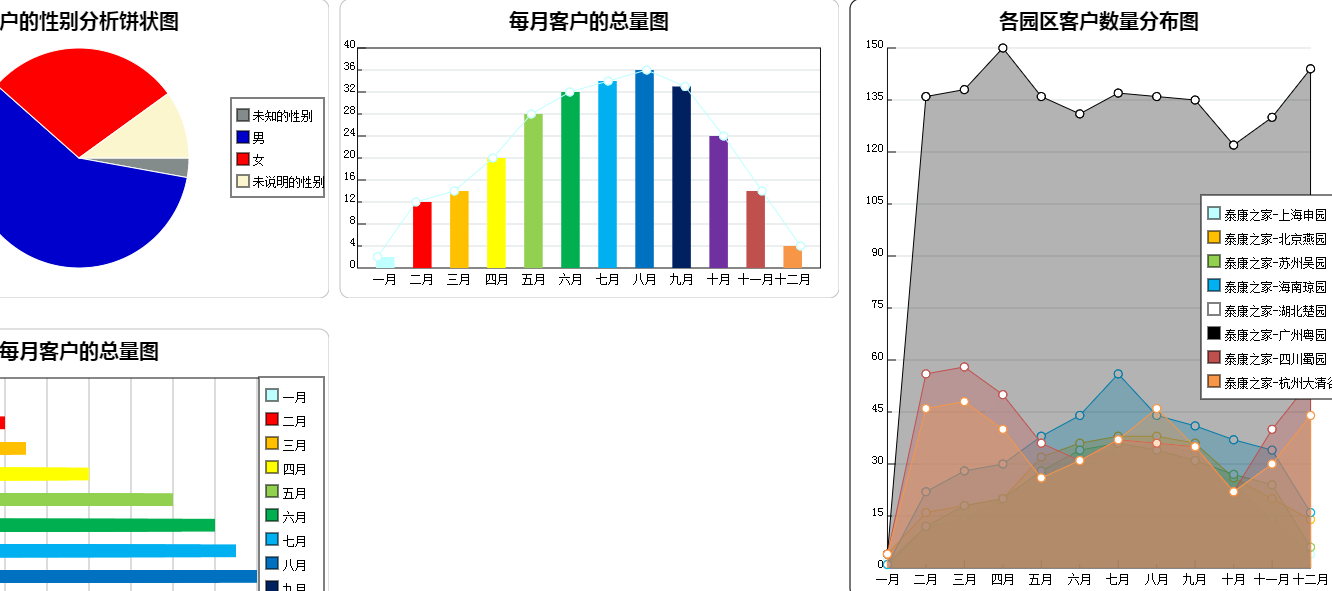
4、效果图为


 156
156

 被折叠的 条评论
为什么被折叠?


