


dstat工具,可以做更多的信息采集
安装
[root@hky-linux1 Server]# rpm -ivh dstat-0.6.6-3.el5_4.1.noarch.rpm
warning: dstat-0.6.6-3.el5_4.1.noarch.rpm: Header V3 DSA signature: NOKEY, key ID 37017186
Preparing... ########################################### [100%]
1:dstat ########################################### [100%]
执行 dstat 命令,默认情况它会收集-cpu-、-disk-、-net-、-paging-、-system-的数据,一秒钟收集一次
语法结构:dstat [-afv] [options..] [delay [count]]
Dstat -c 检测cpu的情况
[root@hky-linux1 ~]# dstat -c
----total-cpu-usage----
usr sys idl wai hiq siq
2 4 90 4 0 0
0 0 100 0 0 0
0 0 100 0 0 0
Dstat -d 检测硬盘读写情况
[root@hky-linux1 ~]# dstat -d
-dsk/total-
read writ
212k 47k
0 0
0 0
0 184k
Dstat -m检测内存使用情况
[root@hky-linux1 ~]# dstat -m
------memory-usage-----
used buff cach free
69M 30M 120M 50M
69M 30M 120M 50M
69M 30M 120M 50M
69M 30M 120M 50M
Dstat -n 检测网络使用状况
[root@hky-linux1 ~]# dstat -n
-net/total-
recv send
0 0
60B 138B
60B 154B
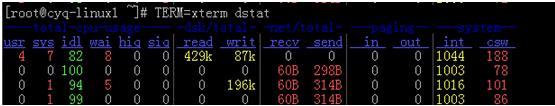
[root@hky-linux1 ~]# dstat -N eth0,total
Terminal width too small, trimming output.
----total-cpu-usage---- -dsk/total- --net/eth0---net/total- ---paging-->
usr sys idl wai hiq siq| read writ| recv send: recv send| in out >
1 2 93 3 0 0| 140k 36k| 0 0 : 0 0 | 0 0 >
0 0 100 0 0 0| 0 0 | 60B 314B: 60B 314B| 0 0 >
0 0 99 0 0 1| 0 0 | 60B 314B: 60B 314B| 0 0 >
[root@hky-linux1 ~]# dstat -dnyc -N eth0 -C total -f 5
Terminal width too small, trimming output.
--dsk/hda-----dsk/sda-----dsk/sdb-----dsk/sdc-- --net/eth0- ---system-->
read writ: read writ: read writ: read writ| recv send| int csw >
537B 0 : 116k 32k:1252B 0 :1354B 0 | 0 0 |1017 112 >
0 0 : 0 0 : 0 0 : 0 0 | 60B 314B|1005 79 >
[root@hky-linux1 ~]# dstat -M time,cpu,net,disk,sys,load,proc,app
Terminal width too small, trimming output.
-----time----- ----total-cpu-usage---- -net/total- -dsk/total- ---system-->
date/time |usr sys idl wai hiq siq| recv send| read writ| int csw >
04-07 01:03:00| 1 2 94 2 0 0| 0 0 | 113k 31k|1016 111 >
04-07 01:03:01| 0 3 96 1 0 0| 60B 420B| 0 0 |1008 94 >
04-07 01:03:02| 1 1 96 2 0 0| 60B 420B| 0 380k|1036 82 >
………………………..
[root@hky-linux1 ~]# man dstat
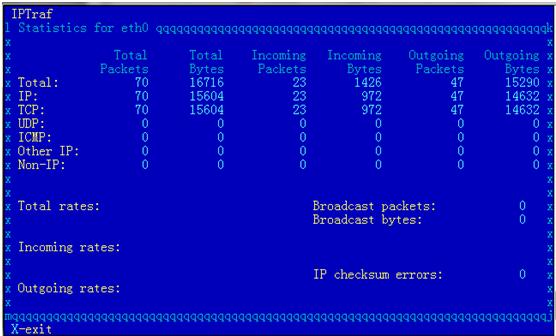
Iptraf的使用:流量监控工具
安装
Yum –y install iptraf
[root@hky-linux1 ~]# iptraf -d eth0 //检测eth0 in和out的数据包
掌握tcpdump的使用
[root@hky-linux1 ~]# tcpdump -nn -vv dst net 192.168.1.0/24 and not port 22
[root@hky-linux1 ~]# tcpdump -nn -vv -i eth0 icmp
tcpdump: listening on eth0, link-type EN10MB (Ethernet), capture size 96 bytes
01:37:31.691978 IP (tos 0x0, ttl 128, id 10925, offset 0, flags [none], proto: ICMP (1), length: 60) 192.168.1.101 > 192.168.1.6: ICMP echo request, id 1, seq 5338, length 40
01:37:31.692256 IP (tos 0x0, ttl 64, id 34721, offset 0, flags [none], proto: ICMP (1), length: 60) 192.168.1.6 > 192.168.1.101: ICMP echo reply, id 1, seq 5338, length 40
Strace工具:跟踪程式执行时的系统调用和所接收的信号
[root@hky-linux1 ~]# man strace
STRACE(1) STRACE(1)
NAME
strace - trace system calls and signals
SYNOPSIS
strace [ -dffhiqrtttTvxx ] [ -acolumn ] [ -eexpr ] ... [ -ofile ] [
-ppid ] ... [ -sstrsize ] [ -uusername ] [ -Evar=val ] ... [ -Evar ]
... [ command [ arg ... ] ]
strace -c [ -eexpr ] ... [ -Ooverhead ] [ -Ssortby ] [ command [ arg
... ] ]
参数:
-c 统计每一系统调用的所执行的时间,次数和出错的次数等
[root@hky-linux1 ~]# strace -c pwd
/root
% time seconds usecs/call calls errors syscall
------ ----------- ----------- --------- --------- ----------------
66.08 0.000596 596 1 execve
14.86 0.000134 17 8 mmap2
6.76 0.000061 20 3 brk
6.76 0.000061 31 2 fcntl64
5.54 0.000050 25 2 munmap
0.00 0.000000 0 1 read
0.00 0.000000 0 1 write
0.00 0.000000 0 3 open
0.00 0.000000 0 5 close
0.00 0.000000 0 1 1 access
0.00 0.000000 0 2 mprotect
0.00 0.000000 0 2 lstat64
0.00 0.000000 0 6 fstat64
0.00 0.000000 0 1 getdents64
0.00 0.000000 0 1 set_thread_area
0.00 0.000000 0 1 openat
0.00 0.000000 0 1 fstatat64
------ ----------- ----------- --------- --------- ----------------
100.00 0.000902 41 1 total
-d 输出strace关于标准错误的调试信息
-f 跟踪由fork调用所产生的子进程
-ff 如果提供-o filename,则所有进程的跟踪结果输出到相应的filename.pid中,pid是各进程的进程号
-F 尝试跟踪vfork调用.在-f时,vfork不被跟踪
-h 输出简要的帮助信息
-i 输出系统调用的入口指针
-q 禁止输出关于脱离的消息
-r 打印出相对时间关于,,每一个系统调用
-t 在输出中的每一行前加上时间信息
-tt 在输出中的每一行前加上时间信息,微秒级
-ttt 微秒级输出,以秒了表示时间
-T 显示每一调用所耗的时
-v 输出所有的系统调用.一些调用关于环境变量,状态,输入输出等调用由于使用频繁,默认不输出
-V 输出strace的版本信息
-x 以十六进制形式输出非标准字符串
-xx 所有字符串以十六进制形式输出
-a column
五 制造系统压力
[root@hky-linux1 ~]# S=1000; echo "scale=${S}; 4*a(1)" | bc -l -q
Vmstat的一个脚本
[root@hky-linux1 ~]# vmstat 1 2 | grep -v sw | awk '{print $0; for (i=1;i<=NF;i++){r[i]+=$i}}END {for(i=1;i<=NF;i++){printf"%d",r[i]/NR;printf("\n")}}'
转载于:https://blog.51cto.com/hky008/464668


 468
468


 被折叠的 条评论
为什么被折叠?
被折叠的 条评论
为什么被折叠?
 到【灌水乐园】发言


