BirdFluCases.txt1 饼图
1.1 载入数据
setwd("E:/R/R-beginer-guide/data/RBook")
    BFCases <- read.table(file="BirdFluCases.txt",header=TRUE)
    names(BFCases)
    str(BFCases)
>     setwd("E:/R/R-beginer-guide/data/RBook")
>     BFCases <- read.table(file="BirdFluCases.txt",header=TRUE)
错误于make.names(col.names, unique = TRUE) : 多字节字符串8有错
>     names(BFCases)
错误: 找不到对象'BFCases'
>     str(BFCases)
错误于str(BFCases) : 找不到对象'BFCases'
>
打开BirdFluCases.txt文件,发现有个’?‘ 删除即可
再次运行载入脚本
>  setwd("E:/R/R-beginer-guide/data/RBook")
>     BFCases <- read.table(file="BirdFluCases.txt",header=TRUE)
>     names(BFCases)
 [1] "Year"       "Azerbaijan" "Bangladesh" "Cambodia"   "China"
 [6] "Djibouti"   "Egypt"      "Indonesia"  "Iraq"       "LaoPDR"
[11] "Myanmar"    "Nigeria"    "Pakistan"   "Thailand"   "Turkey"
[16] "VietNam"
>     str(BFCases)
'data.frame':   6 obs. of  16 variables:
 $ Year      : int  2003 2004 2005 2006 2007 2008
 $ Azerbaijan: int  0 0 0 8 0 0
 $ Bangladesh: int  0 0 0 0 0 1
 $ Cambodia  : int  0 0 4 2 1 0
 $ China     : int  1 0 8 13 5 3
 $ Djibouti  : int  0 0 0 1 0 0
 $ Egypt     : int  0 0 0 18 25 7
 $ Indonesia : int  0 0 20 55 42 18
 $ Iraq      : int  0 0 0 3 0 0
 $ LaoPDR    : int  0 0 0 0 2 0
 $ Myanmar   : int  0 0 0 0 1 0
 $ Nigeria   : int  0 0 0 0 1 0
 $ Pakistan  : int  0 0 0 0 3 0
 $ Thailand  : int  0 17 5 3 0 0
 $ Turkey    : int  0 0 0 12 0 0
 $ VietNam   : int  3 29 61 0 8 5
>
Cases <- rowSums(BFCases[,2:16])
 names(Cases) <- BFCases[,1]
 Cases
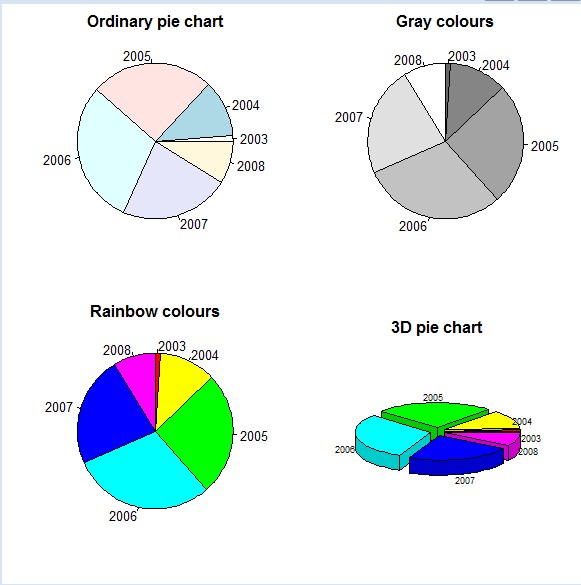
par(mfrow=c(2,2),mar=c(3,2,2,1))
    pie(Cases,main="Ordinary pie chart")
    pie(Cases,col=gray(seq(0.4,1.0,length=6)),clockwise=TRUE,main="Gray colours")
    pie(Cases,col=rainbow(6),clockwise=TRUE,main="Rainbow colours")
    library(plotrix)
    pie3D(Cases,labels=names(Cases),explode=0.1,main="3D pie chart",labelcex=0.6)
效果图:

par函数:mfrowc(2,2)表示生成四个面板 mar用来调整四侧边缘线的数目
clockwise=TRUE 表示按照瞬时间排时间
2 条形图
载入数据
BFDeaths <- read.table(file="BirdFluDeaths.txt",header=TRUE)
    Deaths <- rowSums(BFDeaths[,2:16])
    names(Deaths) <-    BFDeaths[,1]
    Deaths
par(mfrow = c(2,2),mar = c(3,3,2,1))
    barplot(Cases,main="Bird Flu cases")
    Counts <- cbind(Cases,Deaths)
    barplot(Counts)
    barplot(t(Counts),col = gray(c(0.5,1)))
    barplot(t(Counts),beside = TRUE)

3 显示均值和标准差的条形图
载入数据
Benthic <- read.table(file="RIKZ2.txt",header = TRUE)
   Bent.M <- tapply(Benthic$Richness,INDEX=Benthic$Beach,FUN=mean)
   Bent.sd <- tapply(Benthic$Richness,INDEX=Benthic$Beach,FUN=sd)
   MSD <- cbind(Bent.M,Bent.sd)
   MSD
图形显示代码
barplot(Bent.M)
   barplot(Bent.M,xlab="Beach",ylim=c(0,20),ylab="Richness",col=rainbow(9))
   bp <- barplot(Bent.M,xlab="Beach",ylim=c(0,20),ylab="Richness",col=rainbow(9))
   arrows(bp,Bent.M,bp,Bent.M+Bent.sd,lwd=1.5,angle=90,length=0.1)
   box()
Benth.le <- tapply(Benthic$Richness,INDEX=Benthic$Beach,FUN=length)
   Benth.se <- Bent.sd / sqrt(Benth.le)
   stripchart(Benthic$Richness ~ Benthic$Beach,vert = TRUE,pch=1,method="jitter",
              jit=0.05,xlab="Beach",ylab="Richness")
   points(1:9,Bent.M,pch=16,cex=1.5)
   arrows(1:9,Bent.M,1:9,Bent.M+Benth.se,lwd = 1.5,angle = 90,length = 0.1)
   arrows(1:9,Bent.M,1:9,Bent.M-Benth.se,lwd = 1.5,angle = 90,length = 0.1)
盒形图
载入数据
Owls <- read.table("Owls.txt",header = TRUE)
    boxplot(Owls$NegPerChick,main="Negotiation per chick")
描绘图形
par(mfrow = c(2,2),mar = c(3,3,2,1))
    boxplot(NegPerChick ~ SexParent,data = Owls)
    boxplot(NegPerChick ~ FoodTreatment,data = Owls)
    boxplot(NegPerChick ~ SexParent * FoodTreatment,data = Owls)
    boxplot(NegPerChick ~ SexParent * FoodTreatment,names = c("F/Dep","M/Dep","F/Sat","M/Sat"),data = Owls)
另外一个盒形图
代码
par(mar = c(2,2,3,3))
    boxplot(NegPerChick ~ Nest,data = Owls,axes = FALSE,ylim =c (-3,8.5))
    axis(2,at = c(0,2,4,6,8))
    text(x=1:27,y = -2,labels=levels(Owls$Nest),cex=0.75,srt = 65)
Deer <- read.table(file="Deer.txt",header =  TRUE,fill = TRUE)

    dotchart(Deer$LCT,xlab="Length (cm)",ylab=" Observation number")
    Isna <- is.na(Deer$Sex)
    dotchart(Deer$LCT[!Isna],groups=factor(Deer$Sex[!Isna]),xlab="Length(cm)",
            ylab="Observation number grouped by sex)

另外一个添加均值的例子
Benthic <- read.table(file="RIKZ2.txt",header = TRUE)
   Benthic$fBeach <- factor(Benthic$Beach)
   par(mfrow = c(1,2))
   dotchart(Benthic$Richness,groups = Benthic$fBeach,xlab = "Richness",ylab="Beach")
   Bent.M <- tapply(Benthic$Richness,Benthic$Beach,FUN=mean)
   dotchart(Benthic$Richness,groups = Benthic$fBeach,gdata=Bent.M,
            gpch=19,xlab="Richness", ylab="Beach")
legend("bottomright",c("values","mean"),pch=c(1,19),bg="white") 
plot实战1
plot(y = Benthic$Richness,x = Benthic$NAP,xlab="Mean high tide (m)",
        ylab="Species richness",main="Benthic data")
   M0 <- lm(Richness ~ NAP ,data = Benthic)
   abline(M0)
plot(y = Benthic$Richness,x = Benthic$NAP,
          xlab="Mean high tide (m)",ylab="Species richness",
          main="Benthic data",xlim=c(-3,3),ylim=c(0,20))
plot(y = Benthic$Richness,x = Benthic$NAP,  type="n",axes=FALSE ,
          xlab="Mean high tide (m)",ylab="Species richness")
   points(y = Benthic$Richness,x = Benthic$NAP)
plot(y = Benthic$Richness,x = Benthic$NAP,  type="n",axes=FALSE ,
          xlab="Mean high tide (m)",ylab="Species richness",
          xlim = c(-1.75,2),ylim = c(0,20))
  points(y = Benthic$Richness,x = Benthic$NAP)
  axis(2,at = c(0,10,20),tcl = 1)
  axis(1,at = c(-1.75,0,2),labels=c("Sea","Water line","Dunes"))
Birds  <- read.table(file="loyn.txt",header =TRUE)
  Birds$LOGAREA <- log10(Birds$AREA)
  plot(x=Birds$LOGAREA,y=Birds$ABUND,xlab="Log transformed area",
      ylab="Bird adbundance")

  M0 <- lm(ABUND~LOGAREA+GRAZE,data=Birds)
  summary(M0)

  LAR <- seq(from=-1,to =3,by =1)

  ABUND1 <- 15.7+7.2*LAR
  ABUND2 <- 16.1+7.2*LAR
  ABUND3 <- 15.5+7.2*LAR
  ABUND4 <- 14.1+7.2*LAR
  ABUND5 <- 3.8+7.2*LAR

  lines(LAR,ABUND1,lty = 1,lwd=1,col=1)
  lines(LAR,ABUND2,lty = 2,lwd=2,col=2)
  lines(LAR,ABUND3,lty = 3,lwd=3,col=3)
  lines(LAR,ABUND4,lty = 4,lwd=4,col=4)
  lines(LAR,ABUND5,lty = 5,lwd=5,col=5)

  legend.txt <- c("Graze 1","Graze 2","Graze 3","Graze 4","Graze 5")
  legend("topleft",legend=legend.txt,
        col=c(1,2,3,4,5),
        lty=c(1,2,3,4,5),
        lwd=c(1,2,3,4,5),
        bty="o",cex=0.8)
Whales <- read.table(file="TeethNitrogen.txt",
                      header=TRUE)
  N.Moby <- Whales$X15N[Whales$Tooth=="Moby"]
  Age.Moby <- Whales$Age[Whales$Tooth=="Moby"]
  plot(x=Age.Moby,y=N.Moby,xlab="Age",ylab=expression(paste(delta^{15},"N")))


 2703
2703

 被折叠的 条评论
为什么被折叠?


