


Lars Vogel
Version 1.1
Copyright © 2009, 2010, 2011, 2012, 2013 Lars Vogel
30.04.2013
| Revision History | |||
|---|---|---|---|
| Revision 0.1 - 1.2 | 01.10.2009 - 07.11.2013 | Lars Vogel | create, bugzilla and enhancements |
Table of Contents
1. Memory handling in Java 1.1. Native Memory 1.2. Memory in Java 1.3. Java Heap 1.4. Java Stack 1.5. Escape analysis 1.6. Memory leaks 2. Analyzing memory leaks with with Eclipse 2.1. Heap dump 2.2. Analyzing Android heap dumps with Eclipse 2.3. Use the Eclipse Memory Analyzer 3. Installation 4. Example 4.1. Create Project 4.2. Run Project 5. jconsole 6. Thank you 7. Questions and Discussion 8. Links and Literature 8.1. Source Code 8.2. MAT Resources 8.3. vogella ResourcesJava handles its memory in two areas. The heap and the stack. We will start with a short overview of memory in general on a computer. Then the Java heap and stack is explained.
Native memory is the memory which is available to a process, e.g. the Java process. Native memory is controlled by the operating system (OS) and based on physical memory and other physical devices, e.g. disks, flash memory, etc.
The processor (CPU) of the computer computes the instructions to execute and stores its computation results into registers. These registers are fast memory elements which stores the result of the CPU. The processor can access the normal memory over the memory bus. A amount of memory a CPU can access is based on the size of the physical address which the CPU uses to identify physical memory. A 16-bit address can access 2^16 (=65.536) memory locations. A 32-bit address can access 2^32 (=4.294.967.296) memory locations. If each memory area consists of 8 bytes then a 16-bit system can access 64KB of memory and the 32-bit system can access 4GB of memory.
An operating system (OS) normally uses virtual memory to map the physical memory to memory which each process can see. The OS assigns then memory to each process in a virtual memory space for this process and maps access to this virtual memory to the real physical memory.
Current 32-bit systems uses an extension (Physical Address Extension (PAE)) which extends the physical space to 36-bits of the operation system. This allows the OS to access 64GB. The OS uses then virtual memory to allow the individual process 4 GB of memory. Even with PAE enabled a process can not access more then 4 GB of memory.
Of course with a 64-bit OS this 4GB limitation does not exists any more.
Java manages the memory for use. New objects created and placed in the heap. Once your application have no reference anymore to an objects the Java garbage collector is allowed to delete this object and remove the memory so that your application can use this memory again.
In the heap the Java Virtual Machine (JVM) stores all objects created by the Java application, e.g. by using the "new" operator. The Java garbage collector (gc) can logically separate the heap into different areas, so that the gc can faster identify objects which can get removed
The memory for new objects is allocated on the heap at run time. Instance variables live inside the object in which they are declared.
Stack is where the method invocations and the local variables are stored. If a method is called then its stack frame is put onto the top of the call stack. The stack frame holds the state of the method including which line of code is executing and the values of all local variables. The method at the top of the stack is always the current running method for that stack. Threads have their own call stack.
As stated earlier Java objects are created and stored in the heap. The programming language does not offer the possibility to let the programmer decide if an objects should be generated in the stack. But in certain cases it would be desirable to allocate an object on the stack, as the memory allocation on the stack is cheaper then the memory allocation in the heap, deallocation on the stack is free and the stack is efficiently managed by the runtime.
The JVM uses therefore internally escape analysis to check if an object is used only with a thread or method. If the JVM identify this it may decide to create the object on the stack, increasing performance of the Java program.
A Java heap dump is a snapshot of the complete Java object graph at a certain point in time. It is stored in a binary format called HPROF.
It includes all objects, fields, primitive types and object references.
The Eclipse MAT tooling is a set of plug-ins which visualize the references to objects based on Java heap dumps and provides tools to identify potential memory leaks.
It is possible to instruct the JVM to create automatically a heap dump in case that it runs out of memory, i.e. in case of a OutOfMemoryError error. To instruct the JVM to create a heap dump in such a situation, start your Java application with the -XX:+HeapDumpOnOutOfMemoryError option.
Android allows to create heap dumps of an application's heap. This heap dump is stored in a binary format called HPROF. To create a heap dump us the Dump HPROF file button in the DDMS Perspective.
The Dalvik format is similar to the Java heap dump format. To convert the Dalvik heap dump to the Java heap format you can use the hprof-conv source target command.
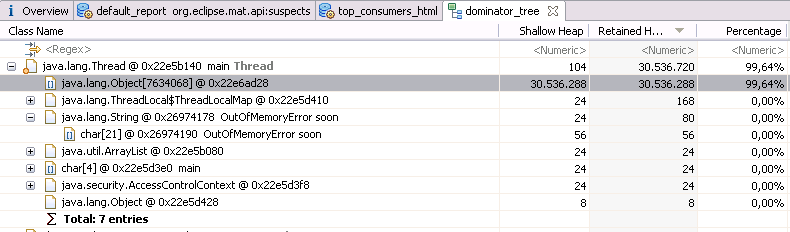
After a new heap dump with the .hprof ending has been created, you can open it via a double-click in Eclipse. You may need to refresh your project (F5 on the project). Double-click the file and select the Leak Suspects Report.

The overview page allows you to start the analysis of the heap dump. The dominator tree gives quickly an overview of the used objects.
Install Eclipse MAT via the Eclipse Update manager Select General Purpose Tools and install the Memory Analyzerand Memory Analyzer (Charts) .
Create the Java project called com.vogella.mat.first and the com.vogella.mat.first package. Create the following class.
package com.vogella.mat.first; import java.util.ArrayList; import java.util.List; public class Main {
/** * @param args */
public static void main(String[] args) { List<String> list = new ArrayList<String>(); while (1<2){ list.add("OutOfMemoryError soon"); } } }

You can also interactive create a heap dumps via the jconsole, a tool which is included in the JDK. Type jconsole in the command line to start it.
To allow a Java program the access of jconsole use the -Dcom.sun.management.jmxremote start option.
Use them MBeans | com.sun.management | HotSpotDiagnostics | Operations |DumpHead .
More info can be found in JConsole and JConsole Tutorial.

If you find errors in this tutorial, please notify me (see the top of the page). Please note that due to the high volume of feedback I receive, I cannot answer questions to your implementation. Ensure you have read the vogella FAQ as I don't respond to questions already answered there.
vogella Training Android and Eclipse Training from the vogella team
Android Tutorial Introduction to Android Programming
GWT Tutorial Program in Java, compile to JavaScript and HTML
Eclipse RCP Tutorial Create native applications in Java
JUnit Tutorial Test your application
Git Tutorial Put all your files in a distributed version control system


 456
456

 被折叠的 条评论
为什么被折叠?
被折叠的 条评论
为什么被折叠?
 到【灌水乐园】发言


