


转自:https://www.chromium.org/developers/how-tos/debugging-on-windows
Debugging Chromium on Windows
|
This page has detailed information to help you debug Chromium on Windows.
Note: If you've never built or debugged Chromium on Windows, first read the
Windows build instructions.
Before you startRequirements
You can use Visual Studio's built-in debugger or
WinDBG to debug Chromium. Note that if you are using goma to build, much of this will not work; see
"Unable to set breakpoints in VS when building with goma on Windows".
Optional
So that you can continue to run release versions of the browser — and avoid incompatible profile changes — while you debug, you should use a different profile for your debug Chromium instance from the release build that you use. You can set the profile by modifying the command line used to launch Chromium from the debugger. To do this, go to the
Debugging tab of the properties of the chrome project, and set the
Command Arguments field to --user-data-dir=c:\tmp\my_debug_profile. (Replace c:\tmp\my_debug_profile with a directory of your choosing.) Another possibility, if you have lots of different checkouts, is to change the path of the shortcut you use for the release build so that it
sets the profile.
Tools such as
ProcessExplorer, Spy++/
Winspector Spy, Inspect32, and
FileMon may be of use when debugging different parts of Chromium.
Multi-process issuesChromium can be challenging to debug because of its multi-process architecture. When you select Run in the debugger, only the main Browser process will be debugged. The code that actually renders web pages (the Renderer) and the plugins will be in separate processes that's not (yet!) being debugged. There are a number of approaches to solving this problem. Single-process modeThe easiest way to debug issues is to run Chromium in single-process mode. This will allow you to see the entire state of the program without extra work (although it will still have many threads). To use single-process mode, add the command-line flag
Using Image File Execution Options
Using Image File Execution Options (IFEO)
will not work, because
CreateProcess() returns the handle to the debugger process instead of the intended child process. There are issues too with the sandbox.
Enable Chrome debug logging to a file by passing
--enable-logging --v=1 command-line flags at startup. Debug builds place the
chrome_debug.log file in the
out\Debug directory. Release builds place the file in the top level of the user data Chromium app directory, which is OS-version-dependent. For more information, see
logging and
user data directory details.
Debugging with Visual StudioAttaching to the renderer
You can also attach to the running child processes with the debugger. Select
Tools > Attach to Process and click the
chrome.exe process you want to attach to. You can now debug the two processes as if they were one.
Use this macro or the vs-chromium plug-in to attach to the right processes.
When you are debugging multiple processes, open the
Debug > Windows > Processes window to switch between them.
Sometimes you are debugging something that only happens on startup, and want to see the child process as soon as it starts. In this case, you can use the
--renderer-startup-dialog command line flag to the browser.Important note: If you use this flag you also have to pass the --no-sandbox flag, since the sandbox will otherwise prevent the renderer from showing a startup dialog. The browser will pass this along to each renderer it starts, which will display a message box as soon as it starts. When the dialog appears, visit Tools > Attach to Process and attach to the process showing the Renderer startup dialog. Now you're debugging in the renderer.
Semi-automatically attaching the debugger to child processes
The following flags cause the processes to wait for 60 seconds in a busy loop for a debugger to attach to the process. Once either condition is true, it continues on; no exception is thrown. This is
the only reliable way to debug an issue occurring on process startup with Visual Studio.
Usagechrome.exe [--wait-for-debugger-children[=filter]] [--wait-for-debugger]
Symbol server
Save yourself some time and debug an official build! Setup your symbols:
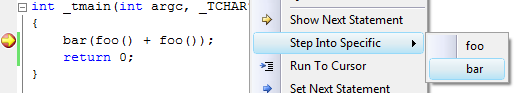
Don't step into trivial functions
Right click and select
"Step Into Specific" when the current statement is on a line with multiple function calls.
Debugging with WinDBGWinDBG is a great, free tool. It is more powerful than Visual Studio's built-in debugger, but is harder to use (kind of like gdb on Linux). You can retrieve the latest version from Microsoft's web site. You should end up with two versions of the tool: the 32-bit debugger and the 64-bit debugger. Most of the time the one that you should use for Chromium is the 32-bit version.Initial setup
Once you're started, you may wish to fix a few things:
Common commands
Common commands when working with a crash
For more info, see this example of working with a crash dump, consult the program help (really, it's exhaustive!), see Common windbg commands or use your favorite search engine.
V8 and Chromium
V8 supports many command-line flags that are useful for debugging. V8 command-line flags can be set via the Chromium command-line flag
--js-flags; for instance:
chrome.exe --js-flags="--trace_exception --heap_stats" Note that some V8 command-line flags exist only in the debug build of V8. For a list of all V8 flags try: chrome.exe --js-flags="--help" Graphical Debugging
GPU Acceleration of rendering can be more easily debugged with tools. See:
Debugging on another machine
Sometimes it's useful to debug installation and execution on a machine other than your primary build box. To run the installer on said other machine, first build the mini_installer target on your main build machine (e.g., ninja -C out\Debug mini_installer). Next, on the debug machine:
Consider reading the documentation at the top of copy-installer.bat to see how you can run it. It tries to be smart and copy the right things, but you may need to be explicit (e.g., "copy-installer.bat out Debug"). It is safe to re-run the script to copy only modified files (after a rebuild, for example).
Miscellaneous
{,,kernel32.dll}_CreateFileW@28
|


 386
386

 被折叠的 条评论
为什么被折叠?
被折叠的 条评论
为什么被折叠?
 到【灌水乐园】发言


