1.查找root下最大的文件并列出前十个
[root@zhangxc ~]# find -type f -exec du -k {} \; | sort -nr | head -10
[root@zhangxc ~]# find -type f -exec du -k {} \; | sort -nr | tail -10     #为后十个
2.查找history的命令输出出现的次数即命令打印前十个
[root@zhangxc ~]# cat .bash_history | awk '{print $1}' | sort | uniq -c | sort -nr | head -103.列出/etc/passwd 后五行的 用户id及用户名
[root@zhangxc ~]# tail -5 /etc/passwd | awk -F: '{print $3" "$1}'
[root@zhangxc ~]# tail -5 /etc/passwd | awk -F: '{print "uid为"$3"的用户是"$1}'
4.列出系统开机时间,系统在过去的1分钟、5分钟和15分钟内的平均负载。并将结果输出到文件mydata中去
[root@zhangxc ~]# uptime | awk '{print $1,$(NF-2),$(NF-1),$(NF) }' | tr -d ',' >>mydata
[root@zhangxc ~]# cat mydata
22:06:03 0.00 0.03 0.23
5.让系统每一分钟采集一次数据,并将其放入~/mydata
[zhangxc@zhangxc root]$ crontab -e
[zhangxc@zhangxc root]$ crontab -l
* * * * * uptime | awk '{print $1,$(NF-2),$(NF-1),$(NF) }' | tr -d ',' >>~/mydata
6.让采集到的数据进行绘图,绘出1分钟、5分钟和15分钟内的平均负载
[root@zhangxc ~]# yum install  gnuplot.x86_64 gnuplot-common.x86_64
[root@zhangxc ~]# gnuplot
gnuplot> set xdata time             //让x轴为时间
gnuplot> set timefmt '%H%M%S'       //设定时间格式   也可设为'%H%M%S'
gnuplot> set xlabel 'TIME'          //x轴名称
gnuplot> set ylabel 'AVERAGE'       //y轴名称
gnuplot> set xtics rotate           //让时间表竖着放
gnuplot> plot '~/mydata' u 1:2 t '1-min' with lines ,'~/mydata' u 1:3 t '5-min' with lines,'~/mydata' u 1:4 t '15-min' with lines
7.写个脚本让gnuplot将绘制好的图(数据为上面采集到的),以*.png的格式输出,并且在网页显示,同时数据更新。(每三分钟更新一次)
1)脚本的内容
[root@zhangxc ~]# cat /opt/cpuload.gnuplot
#!/bin/bash

uptime | awk '{print $1,$(NF-2),$(NF-1),$(NF) }' | tr -d ',' >>/opt/mydata

gnuplot    <<EOF
set terminal png tiny font '/usr/share/fonts/liberation/LiberationSans-Regular.ttf'
set output '/var/www/html/loadavg.png'
set xdata time
set timefmt '%H:%M:%S'
set xlabel 'TIME'
set format x '%H:%M'
set xtics rotate
set ylabel 'load average'
plot '/opt/mydata' u 1:2 t '1-min' with lines, '/opt/mydata' u 1:3 t '5-min' with lines,'/opt/mydata' u 1:4 t '15-min' with lines
EOF
#记得chmod +x /opt/cpuload.gnuplot
2).gnuplot.html代码
[root@zhangxc ~]# cat /var/www/html/gnuplot.html
<html>
<h1>Performance Charts</h1>
<a href="/loadavg.png">LOAD Acerage</a>
</html>
3).crontab 内容
[root@zhangxc ~]# crontab -l
* * * * * uptime | awk '{print $1,$(NF-2),$(NF-1),$(NF) }' | tr -d ',' >>/opt/mydata
*/3 * * * * /opt/cpuload.gnuplot
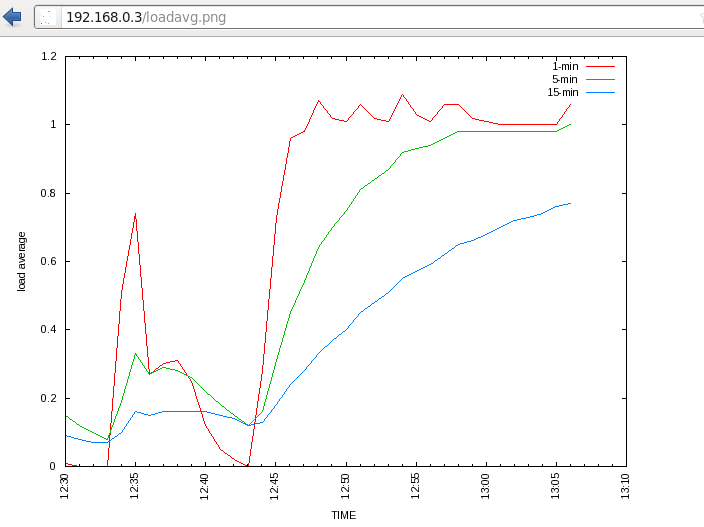
4).访问网页

上图为我做出来的图,每个3分钟手动刷新,图片就会更新。
8.检测根分区使用量是否大于50%,并且输出
[root@zhangxc ~]# df | grep /$ | awk '{print $(NF-1)}' | awk -F% '{if($1>50){print "根分区使用量大于50%"} else {print "根分区使用量小于50%"}}'
根分区使用量小于50%
9.显示所有进程占memery总和
root@zhangxc ~]# ps -eo rss | awk 'BEGIN {print "所有进程所占memory总和:"} /^ *[0-9]/ { rss_total += $1} END {print rss_total }'
所有进程所占memory总和:
899404
10.查看主机ip及子网掩码
[root@zhangxc ~]# ifconfig br0 | grep "inet addr" | awk -F: '{print $2,$NF}' | awk '{print $1"/"$3}'
192.168.1.233/255.255.255.0
11.写脚本以交互式,让用户获取相应的信息(即8.9.10的问题)
脚本如下:(使用case语句)
[root@zhangxc opt]# cat case.sh
#!/bin/bash
echo -e "
    \033[49;31;7m A \033[0m 显示主机ip/子网掩码
    \033[49;32;7m B \033[0m 显示根分区数据数据使用量
    \033[49;33;7m C \033[0m 显示memory被进程所占总和
"
read -p "请输入你的选择:" num

case $num in
a|A)
    ifconfig br0 | grep "inet addr" | awk -F: '{print $2,$NF}' | awk '{print $1"/"$3}'
    ;;
b|B)
    df | grep /$ | awk '{print $(NF-1)}' | awk -F% '{if($1>50){print "根分区使用量大于50%"} else {print "根分区 使用量小于50%"}}'
    ;;
c|C)
    ps -eo rss | awk 'BEGIN {print "所有进程所占memory总和:"} /^ *[0-9]/ { rss_total += $1} END {print rss_total }'
    ;;
*)
    echo "必须输入[A|B|C]"
esac
运行状态

欢迎大家关注我的微博进行交流 @我爱吃葱花xc


 428
428

 被折叠的 条评论
为什么被折叠?


