How to enable logging

转自:https://www.chromium.org/for-testers/enable-logging


How to enable logging

To enable logging, launch Chrome with these command line flags:
 
--enable-logging --v=1
 
  • This will turn on full logging support (INFO, WARNING, ERROR, and VERBOSE0 for >=M9).
  • Verbose logging shows up with their own VERBOSEn label.
    • --vmodule enables verbose logging on a per module basis. Details in base/logging.h.
  • Most logs that used to be INFO have been moved to use verbose logging.
  • Any page load (even the new tab page) will print messages tagged with VERBOSE1; for example:
  •     [28304:28320:265508881314:VERBOSE1:chrome/browser/renderer_host/resource_dispatcher_host.cc(1098)] OnResponseStarted: chrome://newtab/
  • The output will be saved to the file chrome_debug.log in Chrome's user data directory (in the parent directory of Default/) for a release build, and in the binary build folder (e.g. out\Debug) for a debug build. On Chrome OS, messages logged by Chrome are written to files within /var/log/chrome at the login screen and to files within the log subdirectory under the logged-in user's encrypted home directory, which resides under/home/chronos.
  • With --enable-logging=stderr the output will be printed to standard error (not available on Windows)
  • This file is overwritten each time you restart chrome.
  • To enable logging from the render processes on Windows you also need the --no-sandboxcommand line flag.
     
  • To see WTF_LOG, use --blink-platform-log-channels
Note that:
  • The location of Chrome's user data directory depends on your operating system, and whether you are using Chrome vs Chromium.
  • The above document lists the path to the Default/ directory; the chrome_debug.log file we are interested in is actually one directory above this (i.e. the parent directory)
  • If the environment variable CHROME_LOG_FILE is set, Chrome will write its debug log to its specified location.  Example: Setting CHROME_LOG_FILE to "chrome_debug.log" will cause the log file to be written to the Chrome process's current working directory while setting it to "D:\chrome_debug.log" will write the log to the root of your computer's D: drive.
  • To override the log file path in a test harness that runs Chrome, use this pattern:
    #include "chrome/common/env_vars.h"
    ...
    // Set the log file path in the environment for the test browser.
    std::wstring log_file_path = ...;
    SetEnvironmentVariable(env_vars::kLogFileName, log_file_path.c_str());

How do I specify the command line flags?

See  this page.

What personal information does the log file contain?

Before attaching your  chrome_debug.log to a bug report, be aware that it can contain some personal information, such as URLs opened during that session of chrome.
 
Since the debug log is a human-readable text file, you can open it up with a text editor (notepad, vim, etc..) and review the information it contains, and erase anything you don't want the bug investigators to see.
 
The boilerplate values enclosed by brackets on each line are in the format:
 
[process_id:thread_id:ticks_in_microseconds:log_level:file_name(line_number)]

Sawbuck

Alternatively to the above, you can use the Sawbuck utility (for Windows) to view, filter and search the logs in realtime, in a handy-dandy GUI.
 
First download and install the latest version of  Sawbuck, launch it, then select "Configure Providers.." form the "Log" menu.
This will bring up a dialog that looks something like this:
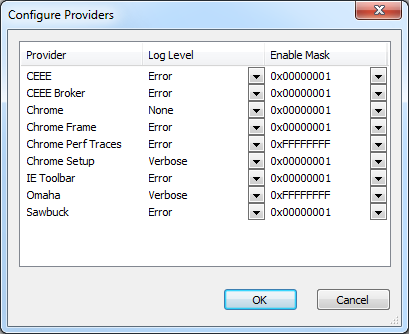
Set the log level for Chrome, Chrome Frame, and/or the Setup program to whatever suits you, and click "OK". You can revisit this dialog at any time to increase or decrease the log verbosity.
Now select "Capture" from the "Log" menu, and you should start seeing Chrome's log messages.
Note that Sawbuck has a feature that allows you to view the call trace for each log message, which can come in handy when you're trying to home in on a particular problem.
 
Note: If you're installing Sawbuck for the first time, you may need to quit and relaunch your Chrome, as the logging transport used by Sawbuck is only enabled under an environment variable, which is set by the installer.
  • 0
    点赞
  • 0
    收藏
    觉得还不错? 一键收藏
  • 0
    评论
An active internet connection Java 8+ Docker Maven Git client Chapter 1, Introduction to Microservices, will introduce you to the microservices architecture, cloud environment, etc. You will learn the difference between a microservice based application and a monolith application while also learning how to migrate to a microservices application. Chapter 2, Spring for Microservices, will introduce you Spring Boot framework. You will learn how to effictively use it to create microservice application. We will cover such topics like creating REST API using Spring MVC annotations, providing API documentation using Swagger2, and exposing health checks and metrics using Spring Boot Actuator endpoints. Chapter 3, Spring Cloud Overview, will provide a short description of the main projects being a part of Spring Cloud. It will focus on describing the main patterns implemented by Spring Cloud and assigning them to the particular projects. Chapter 4, Service Discovery, will describe a service discovery pattern with Spring Cloud Netflix Eureka. You will learn how to run Eureka server in standalone mode and how to run multiple server instances with peer-to-peer replication. You will also learn how to enable discovery on the client side and register these clients in different zones. Chapter 5, Distributed Configuration with Spring Cloud Config, will describe how use distributed configuration with Spring Cloud Config in your applications. You will learn how to enable different backend repositories of property sources and push change notifications using Spring Cloud Bus. We will compare discovery first bootstrap and config first bootstrap approaches to illustrate integration between discovery service and configuration server. Chapter 6, Communication Between Microservices, will describe the most important elements taking a part in an inter-service communication: HTTP clients and load balancers. You will learn how to use Spring RestTemplate, Ribbon, and Feign clients with or without

“相关推荐”对你有帮助么?

  • 非常没帮助
  • 没帮助
  • 一般
  • 有帮助
  • 非常有帮助
提交
评论
添加红包

请填写红包祝福语或标题

红包个数最小为10个

红包金额最低5元

当前余额3.43前往充值 >
需支付:10.00
成就一亿技术人!
领取后你会自动成为博主和红包主的粉丝 规则
hope_wisdom
发出的红包
实付
使用余额支付
点击重新获取
扫码支付
钱包余额 0

抵扣说明:

1.余额是钱包充值的虚拟货币,按照1:1的比例进行支付金额的抵扣。
2.余额无法直接购买下载,可以购买VIP、付费专栏及课程。

余额充值