<!DOCTYPE html>
<html>
<head lang="en">
<meta name="viewport" content="width=device-width, initial-scale=1.0, user-scalable=no, minimum-scale=1.0, maximum-scale=1.0" charset="utf-8"/>
<title></title>
<style>
body {
margin: 0;
}
</style>
</head>
<body>
<div>
<canvas id="canvas">
</canvas>
</div>
<script src="./diagram.js"></script>
<script>
var diagram = new Diagram();
diagram.init(
document.getElementById("canvas"),
window.screen.width,
window.screen.height * 2 / 5
);
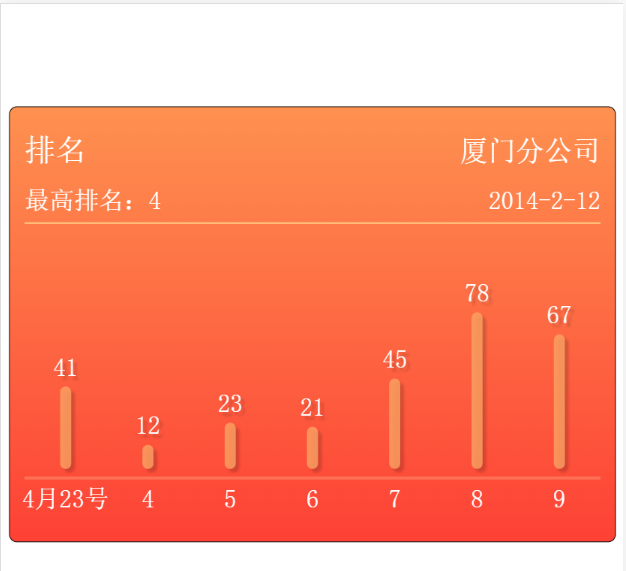
var pm = [41, 12, 23, 21, 45, 78, 67],
pmTop = [41, 12, 23, 21, 45, 78, 67],
pmMin = 4,
companyName = "厦门分公司",
time = "2014-2-12",
footer = ["4月23号", 4, 5, 6, 7, 8, 9];
var list = [
{
hArr: pm,
hArrTop: pmTop,
title: "排名",
subTitle: "最高排名:" + pmMin,
rightTitle: companyName,
rightSubTitle: time,
footer: footer
}
];
diagram.histogram(list);
</script>
</body>
</html>
diagram.js文件
/**
 * methods列表:
 * ①init:初始化canvas
 * ②_resolveData:处理数据
 * drawFont:绘制文字
 * drawLine:绘制线条
 * drawBg:绘制背景
 * drawRoundRect:绘制弧形矩形
 * shadow:添加阴影
*/

var Diagram = function(){
	this.canvas = null;
	this.ctx = null;
	this.w = 0;
	this.h = 0;

	this.wWidth = document.body.clientWidth * 2;
	this.wHeight = document.body.clientHeight * 2;

	this.pos = []; //表格起始坐标位置,左下角,即背景图的位置
	this.tableMarginRightAndLeft = 10; //表格外侧距离,距离画布左侧的距离
	this.tableMarginTopAndBottom = 5;	//表格上下距离
	this.tablePaddingRightAndLeft = 20;	//表格内边距
	this.tablePaddingTopAndBottom = 20;
	//计算绘制区域大小,表格内容总宽,不包含外边距
	this.tableWidth = this.wWidth -this.tableMarginRightAndLeft*2;
	this.tableHeight = this.wHeigh/3 - this.tableMarginTopAndBottom*2;

	//表格内容总宽,不包含内外边距
	this.tableContentWidth = this.tableWidth-this.tablePaddingRightAndLeft*2;
	this.tableContentHeight = this.tableHeight-this.tablePaddingTopAndBottom*2;

	this.data = null;//数据

	this.titleScale = 1/4; 	//表格三者占据的比例
	this.areaScale = 1/2;
	this.bottomScale = 1/7;

	this.iconType = "A";	//图表样式

}

Diagram.prototype.init = function(canvas,w,h,iconType){
	if(iconType){
		this.iconType = iconType;
	}
	this.canvas = canvas;
	this.ctx = canvas.getContext("2d");
	this.w = w*2;
	this.h = h*2;
	this.canvas.width = w*2;
	this.canvas.height = h*2;
	this.canvas.style.width = w + "px";
	this.canvas.style.height = h + "px";
};
// 绑定事件
Diagram.prototype.bindEvent = function(){

}
//获取数据
Diagram.prototype.fetchData = function(cb){

}
//处理数据 ——不太明白 ×××
Diagram.prototype._resolveData = function(data){
	var self = this;
	var num = data.length;//表格个数
	this.tableWidth = this.w - this.tableMarginRightAndLeft*2;
	this.tableHeight = this.h/num - this.tableMarginTopAndBottom*2;
	this.tableContentWidth = this.tableWidth-this.tablePaddingRightAndLeft*2;
	this.tableContentHeight = this.tableHeight-this.tablePaddingTopAndBottom*2;

	for(var i=0;i<num;i++){
		var max = Math.max.apply(this, data[i].hArr); // 取最大值
		max = max*1.2+1;
		data[i].hArr = data[i].hArr.map(function(item,index,arr){
			return self.areaScale*item/max*(self.tableContentHeight-self.w/25);
		});
		this.pos.push({
			x:this.tableMarginRightAndLeft,
			y:this.h/num*(i+1)-this.tableMarginTopAndBottom
		});
	}
	this.data = data;
}
//数据获取失败
Diagram.prototype._fetchDataFailed = function(){}

//绘制直方图
Diagram.prototype.histogram = function(data){
	if(!data){return}
	this._resolveData(data);//处理数据

	var iconType = this.iconType;
	var histogramStyle = this.histogramStyle;

	for(var i = 0;i<data.length;i++){	//绘制图表个数
		//绘制背景
		this.drawBg({
				x : this.pos[i].x,	//背景左下角坐标
				y : this.pos[i].y,
				w : this.tableWidth,	//宽高
				h : this.tableHeight
		},histogramStyle[iconType].bg);
		this.rectMatrix({
				hArr:this.data[i].hArr,	//直方图,柱形高度
				hArrTop:this.data[i].hArrTop,	//直方图,柱形上方显示字体
				pos:{//起始位置
					x:this.pos[i].x,
					y:this.pos[i].y- this.tablePaddingTopAndBottom - this.tableContentHeight*this.bottomScale
				}
			}, histogramStyle[iconType].rectMatrix);
		// //绘制线条,上
		this.drawLine({
				x : this.pos[i].x+this.tablePaddingRightAndLeft,
				y : this.pos[i].y-this.tableHeight*(1-this.titleScale),
				endX : this.pos[i].x+this.tablePaddingRightAndLeft+this.tableContentWidth,
				endY : this.pos[i].y-this.tableHeight*(1-this.titleScale)
		}, histogramStyle[iconType].lineTop );
		//绘制线条,下
		this.drawLine({
				x : this.pos[i].x+this.tablePaddingRightAndLeft,
				y : this.pos[i].y-this.tableContentHeight*this.bottomScale-this.tablePaddingTopAndBottom,
				endX :	this.pos[i].x+this.tablePaddingRightAndLeft+this.tableContentWidth,
				endY :	this.pos[i].y-this.tableContentHeight*this.bottomScale-this.tablePaddingTopAndBottom
		},	histogramStyle[iconType].lineBottom);
		//绘制底部菜单
		this.drawBottomBar({
				O:{
					x:this.pos[i].x+this.tablePaddingRightAndLeft,
					y:this.pos[i].y
				},
				tableWidth:this.tableContentWidth,
				footer:data[i].footer
		},histogramStyle[iconType].drawBottomBar);
		//绘制顶部部菜单
		this.drawHeadBar({
				O:{
					x:this.pos[i].x+this.tablePaddingRightAndLeft,
					y:this.pos[i].y-this.tableHeight*(1-this.titleScale)
				},
				width:this.tableContentWidth,
				height: this.tableContentHeight,
				title:data[i].title || "",
				subTitle:data[i].subTitle || "",
				rightTitle:data[i].rightTitle || "",
				rightSubTitle:data[i].rightSubTitle || ""
		},	histogramStyle[iconType].drawHeadBar);
	}
};
/**
 * 绘制文字 √
 * options :x,y,font,color,textAlign,textBaseline,topFontSizePercent
 * */
Diagram.prototype.drawFont = function(options){
	this.ctx.save();
	this.ctx.fillStyle = options.color || "#fff";
	this.ctx.font = this.w * options.fontSizePercent +"px 宋体";
	this.ctx.textAlign = options.textAlign || "center";
	this.ctx.textBaseline = options.textBaseline ||"bottom";
	this.ctx.fillText(options.font,options.x,options.y);
	this.ctx.restore();
}

// 绘制背景 √
Diagram.prototype.drawBg = function(data,options){
	var x = data.x;
	var y = data.y;
	var w = data.w;
	var h = data.h;
	var bgColor1 = options.bgColor1;
	var bgColor2 = options.bgColor2;

	// 保存画笔状态
	this.ctx.save();
	// 线性渐变:(x,y,x1,y1)起点xy坐标,终点xy坐标
	var gradient = this.ctx.createLinearGradient(x+w/2, y, x+w/2, y-h);
	this.ctx.lineWidth="0";
	// 添加阴影的效果欠佳:去除
	// this.shadow(2,2,2,"rgba(255,214,206,0.5)");
	gradient.addColorStop(0,bgColor1);
	gradient.addColorStop(1,bgColor2);
	this.ctx.fillStyle = gradient;
	// 绘制弧形矩形
	this.drawRoundRect(x,y-h,w,h,10);

	this.ctx.fill();
	this.ctx.stroke();
}
/**
 * 绘制长方形矩阵 √
 * options:
 * lineWPercent:0.25,	//柱形宽度rectRadiusPercent: 0.5,
 * strokeStyle:"rgba(253,163,99,0.8)",	//柱形颜色
 * topFontColor:"#fff",	//柱形顶部文字颜色
 * topFontSizePercent:1/25	//柱形顶部文字大小
*/
Diagram.prototype.rectMatrix = function(data,options){
	var ctx = this.ctx;

	var hArr = data.hArr;	//直方图,柱形高度
	var hArrTop = data.hArrTop;	//直方图,柱形上方显示字体
	var pos = data.pos;	//起始位置

	var lineWPercent = options.lineWPercent;	//柱形宽度
	var rectRadiusPercent = options.rectRadiusPercent;	//柱形圆角大小
	var strokeStyle = options.strokeStyle;	//柱形颜色
	var topFontColor = options.topFontColor;	//柱形顶部文字颜色
	var topFontSizePercent = options.topFontSizePercent;	//柱形顶部文字大小
	var isShadow = options.isShadow;

	var num = hArr.length;		//直方图,柱形个数

	var w = this.tableContentWidth/(num+num-1);
	var lineW = num == 1 ? w/3 : w*lineWPercent;	//柱形宽度
	var y = data.pos.y;	//柱形底部位置

	if(isShadow){
		ctx.save();
		ctx.shadowOffsetX = 5;	//绘制阴影
		ctx.shadowOffsetY = 5;
		ctx.shadowBlur = 4;
		ctx.shadowColor = "rgba(0, 0, 0, 0.2)";
	}

	this.ctx.fillStyle =  strokeStyle;		//填充柱形,颜色
	for(var i=0; i<num; i++){	//绘制柱形
		var x = pos.x + this.tablePaddingRightAndLeft + this.tableContentWidth/num*(1/2+i);
		this.drawRoundRect(x-lineW/2,y-hArr[i],lineW,hArr[i],lineW*rectRadiusPercent);
		this.ctx.fill();
		if(hArrTop){
			//options :x,y,font,color,textAlign,textBaseline,fontSizePercent
			this.drawFont({
				x : x,
				y : y-hArr[i]-10,
				font : hArrTop[i],
				color : topFontColor,
				fontSizePercent : topFontSizePercent
			});
		}//绘制文字
	}
	ctx.restore();
}

// 绘制线条 √
Diagram.prototype.drawLine = function(data,options){
	var x = data.x;
	var y = data.y;
	var endX = data.endX;
	var endY = data.endY;
	var offsetY = options.offsetY;
	var color = options.color  || "#ffa164";
	var lineWidth = options.lineWidth || 4 ;

	var ctx = this.ctx;
	ctx.save()
	ctx.strokeStyle = color;
	ctx.lineWidth = lineWidth;
	ctx.beginPath();
	ctx.moveTo(x, y + parseFloat(lineWidth) + parseFloat(offsetY) );
	ctx.lineTo(endX, endY + parseFloat(lineWidth) + parseFloat(offsetY) );
	ctx.stroke();
	ctx.closePath();
	ctx.restore();
}

// 绘制头部 √
Diagram.prototype.drawHeadBar = function(data,options){
	console.log(data,options)
	var fontColor = options.fontColor || "#fff";
	var O = data.O;

	var ctx = this.ctx;

	ctx.save();
	ctx.translate(O.x,O.y); // 想当与将画布移动到了header的左下角
	ctx.fillStyle = fontColor;

	ctx.textAlign = "start";
	ctx.textBaseline = "bottom";

	ctx.font = this.w/20+"px 宋体";
	ctx.fillText(data.title,0,-this.titleScale*data.height/2);
	ctx.font = this.w/25+"px 宋体";
	ctx.fillText(data.subTitle,0,-4);

	// 观察头部下方的位置
	// ctx.beginPath();
	// ctx.moveTo(0,0);
	// ctx.lineTo(this.tableContentWidth,0);
	// ctx.stroke();

	ctx.textAlign = "end";
	ctx.font = this.w/22+"px 宋体";
	ctx.fillText(data.rightTitle,data.width,-this.titleScale*data.height/2);
	ctx.font = this.w/25+"px 宋体";
	ctx.fillText(data.rightSubTitle,data.width,-4);

	ctx.restore();
}

// 绘制下测样式 √
Diagram.prototype.drawBottomBar = function(data,options){
	var fontColor = options.fontColor || "#fff";
	var fontSizePercent = options.fontSizePercent || 0.04;

	this.ctx.fillStyle = fontColor;
	var arr = data.footer;
	this.ctx.font = this.w * fontSizePercent+"px 宋体";
	this.ctx.textAlign = "center";
	this.ctx.textBaseline = "center";

	// 观察底部的上方位置
	// this.ctx.beginPath();
	// this.ctx.moveTo(data.O.x,data.O.y-this.tableContentHeight*this.bottomScale/3-this.tablePaddingTopAndBottom);
	// this.ctx.strokeStyle = "green";
	// this.ctx.lineTo(this.tableContentWidth,data.O.y-this.tableContentHeight*this.bottomScale/3-this.tablePaddingTopAndBottom);
	// this.ctx.stroke();

	for(var i=0;i<arr.length;i++){
		// 从中间点绘制,居中
		this.ctx.fillText(arr[i],  data.O.x+data.tableWidth/arr.length*(1/2+i),  data.O.y-this.tableContentHeight*this.bottomScale/3-this.tablePaddingTopAndBottom)
	}
}

// 渲染数据
Diagram.prototype.renderData = function(data){

}

// 添加阴影 √
Diagram.prototype.shadow = function(shadowOffsetX,shadowOffsetY,shadowBlur,shadowColor){
	this.ctx.shadowOffsetX = shadowOffsetX || 5;//阴影
	this.ctx.shadowOffsetY = shadowOffsetY || 5;
	this.ctx.shadowBlur = shadowBlur || 4;
	this.ctx.shadowColor = shadowColor || "rgba(0, 0, 0, 0.2)";
}
// 绘制弧形矩形 √
Diagram.prototype.drawRoundRect = function(x, y, width, height, radius){
	var ctx = this.ctx;
    ctx.beginPath();
    ctx.arc(x + radius, y + radius, radius, Math.PI, Math.PI * 3 / 2);
    ctx.lineTo(width - radius + x, y);
    ctx.arc(width - radius + x, radius + y, radius, Math.PI * 3 / 2, Math.PI * 2);
    ctx.lineTo(width + x, height + y - radius);
    ctx.arc(width - radius + x, height - radius + y, radius, 0, Math.PI * 1 / 2);
    ctx.lineTo(radius + x, height +y);
    ctx.arc(radius + x, height - radius + y, radius, Math.PI * 1 / 2, Math.PI);
    ctx.closePath();

}

//直方图样式 √
Diagram.prototype.histogramStyle = {
		A:{
			bg:{
				bgColor1:"#fd4135",	//背景颜色
				bgColor2:"#fe9150"
			},
			rectMatrix:{
				lineWPercent:0.25,	//柱形宽度,百分比
				rectRadiusPercent: 0.5,	//柱形圆角大小
				strokeStyle:"rgba(253,163,99,0.8)",	//柱形颜色
				topFontColor:"#fff",	//柱形顶部文字颜色
				topFontSizePercent:1/25,	//柱形顶部文字大小
				isShadow: true
			},
			lineTop:{
				color: "#ffcd86",		//线颜色
				lineWidth: "2",		//线宽度
				offsetY: "8"	//offsetY在y上偏移
			},
			lineBottom:{
				color :	"#ff7156",
				lineWidth : "4",
				offsetY : "8"
			},
			drawBottomBar:{
				fontColor:"#fff",	//脚部文字颜色
				fontSizePercent: 1/25	//脚部文字大小
			},
			drawHeadBar:{
				fontColor:"#fff"	//顶部文字颜色
			}
		},
		B:{
			bg:{
				bgColor1:"#a3d9e5",	//背景颜色
				bgColor2:"#a3d9e5"
			},
			rectMatrix:{
				lineWPercent:1,	//柱形宽度,百分比
				rectRadiusPercent: 0,	//柱形圆角大小
				strokeStyle:"#f6af3b",	//柱形颜色
				topFontColor:"black",	//柱形顶部文字颜色
				topFontSizePercent:1/25,	//柱形顶部文字大小
				isShadow: false

			},
			lineTop:{
				color: "#a3d9e5",		//线颜色
				lineWidth: "0",		//线宽度
				offsetY: "0"		//offsetY在y上偏移
			},
			lineBottom:{
				color :	"black",
				lineWidth : "1",
				offsetY : "1"
			},
			drawBottomBar:{
				fontColor:"black",	//脚部文字颜色
				fontSizePercent: 1/30	//脚部文字大小
			},
			drawHeadBar:{
				fontColor:"black"	//顶部文字颜色
			}
		}
}

//设置diagram样式
Diagram.prototype.set = function(options){
	var histogram = options.histogram;
	var iconType = options.iconType;
	if(iconType){
		this.iconType = iconType;
	}
	if(options.tablePaddingTopAndBottom){
		this.tablePaddingTopAndBottom = options.tablePaddingTopAndBottom	;
	}
	if(histogram){
		for(item in histogram){
			this[item] = histogram[item];
		}
	}

}
效果图


 3万+
3万+

 被折叠的 条评论
为什么被折叠?
被折叠的 条评论
为什么被折叠?
 到【灌水乐园】发言


