


- 单因素多元方差分析
以MASS包中的UScereal数据集为例,将研究美国谷物众的卡路里、脂肪、糖含量是否因为存储位置的不同而发生变化,1代表底层货架、2代表中层货架、3代表顶层货架。卡路里、脂肪和糖含量是因变量、货架是三水平(1\2\3)的自变量。
> library(MASS)
> attach(UScereal)
The following object is masked _by_ .GlobalEnv:

    shelf

The following objects are masked from UScereal (pos = 3):

    calories, carbo, fat, fibre, mfr, potassium, protein, shelf, sodium, sugars, vitamins


> shelf <- factor(shelf)  #货架转换成因子,后续能作为分组变量
> y <- cbind(calories, fat, sugars)   #将三个因变量(卡路里、脂肪、糖)合并成一个矩阵
> aggregate(y, by=list(shelf), FUN=mean)
  Group.1 calories       fat    sugars
1       1 119.4774 0.6621338  6.295493
2       2 129.8162 1.3413488 12.507670
3       3 180.1466 1.9449071 10.856821

> cov(y)  #输出协方差(自己跟自己的相关性)和协方差(自己和别人的相关性)
           calories       fat     sugars
calories 3895.24210 60.674383 180.380317
fat        60.67438  2.713399   3.995474
sugars    180.38032  3.995474  34.050018


> fit <- manova(y ~ shelf)  #拟合manova()函数,对组间差异进行元检验
> summary(fit)
          Df Pillai approx F num Df den Df    Pr(>F)
shelf      2 0.4021   5.1167      6    122 0.0001015 ***
Residuals 62
---
Signif. codes:  0 ‘***’ 0.001 ‘**’ 0.01 ‘*’ 0.05 ‘.’ 0.1 ‘ ’ 1


> summary.aov(fit)
 Response calories :
            Df Sum Sq Mean Sq F value    Pr(>F)
shelf        2  50435 25217.6  7.8623 0.0009054 ***
Residuals   62 198860  3207.4
---
Signif. codes:  0 ‘***’ 0.001 ‘**’ 0.01 ‘*’ 0.05 ‘.’ 0.1 ‘ ’ 1

 Response fat :
            Df Sum Sq Mean Sq F value  Pr(>F)
shelf        2  18.44  9.2199  3.6828 0.03081 *
Residuals   62 155.22  2.5035
---
Signif. codes:  0 ‘***’ 0.001 ‘**’ 0.01 ‘*’ 0.05 ‘.’ 0.1 ‘ ’ 1

 Response sugars :
            Df  Sum Sq Mean Sq F value   Pr(>F)
shelf        2  381.33 190.667  6.5752 0.002572 **
Residuals   62 1797.87  28.998
---
Signif. codes:  0 ‘***’ 0.001 ‘**’ 0.01 ‘*’ 0.05 ‘.’ 0.1 ‘ ’ 1
- 评估假设检验
单因素多元方差分析有两个前提假设,一个是多元正态性,一个是方差-协方差矩阵同质性。
a、 第一个假设即指因变量组合成的向量服从一个多元正态性。可以用 Q-Q图来检验该假设
center <- colMeans(y)
n <- nrow(y)
p <- ncol(y)
cov <- cov(y)
d <- mahalanobis(y,center,cov)
coord <- qqplot(qchisq(ppoints(n),df=p),
abline(a=0,b=1)
identify(coord$x, coord$y, labels=row.names(UScereal))  #交互性的对地图中的点进行判别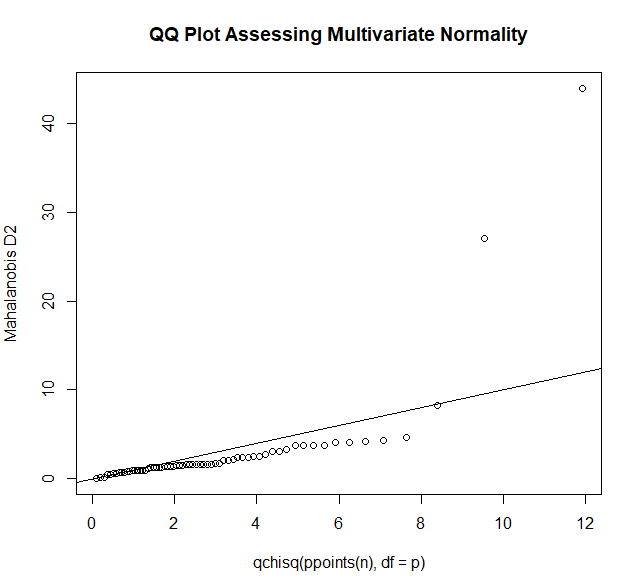
从图形上看,两个观测点似乎违反了多元正态性,可以删除这两点再重新分析
b、方差-协方差矩阵同质性即指各组的协方差矩阵相同


 1346
1346


 被折叠的 条评论
为什么被折叠?
被折叠的 条评论
为什么被折叠?
 到【灌水乐园】发言


