


1
public ActionForward jfree(ActionMapping mapping, ActionForm form, HttpServletRequest request,
HttpServletResponse response) throws IOException {
List<String> list = new ArrayList<String>();
int i =0;
Font font = new Font("sans-serif", Font.PLAIN, 11);
//访问量统计时间线
TimeSeries timeSeries2006 = new TimeSeries("2006年度", "domanin","range");
TimeSeries timeSeries2007 = new TimeSeries("2007年度", "domanin","range");
TimeSeries timeSeries2008 = new TimeSeries("", "","");
//时间曲线数据集合
TimeSeriesCollection lineDataset9 = new TimeSeriesCollection();
//构造数据集合
timeSeries2006.add(new Month(1, 2007), 7200);
timeSeries2006.add(new Month(2, 2007), 7000);
timeSeries2006.add(new Month(3, 2007), 4200);
timeSeries2006.add(new Month(4, 2007), 8200);
timeSeries2006.add(new Month(5, 2007), 7300);
timeSeries2006.add(new Month(6, 2007), 8200);
timeSeries2006.add(new Month(7, 2007), 9200);
timeSeries2006.add(new Month(8, 2007), 7300);
timeSeries2006.add(new Month(9, 2007), 9400);
timeSeries2006.add(new Month(10, 2007), 7500);
timeSeries2006.add(new Month(11, 2007), 6600);
timeSeries2006.add(new Month(12, 2007), 3500);
timeSeries2007.add(new Month(1, 2007), 10200);
timeSeries2007.add(new Month(2, 2007), 9000);
timeSeries2007.add(new Month(3, 2007), 6200);
timeSeries2007.add(new Month(4, 2007), 8200);
timeSeries2007.add(new Month(5, 2007), 8200);
timeSeries2007.add(new Month(6, 2007), 11200);
timeSeries2007.add(new Month(7, 2007), 12200);
timeSeries2007.add(new Month(8, 2007), 8300);
timeSeries2007.add(new Month(9, 2007), 10400);
timeSeries2007.add(new Month(10, 2007), 12800);
timeSeries2007.add(new Month(11, 2007), 10600);
timeSeries2007.add(new Month(12, 2007), 10500);
//timeSeries2007.add(new Month(1, 2008),1);
timeSeries2008.add(new Month(1, 2008),null);
timeSeries2008.add(new Month(12, 2006),null);
lineDataset9.addSeries(timeSeries2006);
lineDataset9.addSeries(timeSeries2007);
lineDataset9.addSeries(timeSeries2008);
JFreeChart jfreechart9 = ChartFactory.createTimeSeriesChart("访问量统计时间线9", "月份", "访问量", lineDataset9, true, true, true);
//设置子标题
TextTitle subtitle9 = new TextTitle("2006/2007年度访问量对比9", font);
jfreechart9.addSubtitle(subtitle9);
//设置主标题
jfreechart9.setTitle(new TextTitle("阿蜜果blog访问量统计9", font));
jfreechart9.setAntiAlias(true);
String filePathImage9 = DateUtil.formatDate2String(new java.util.Date(), "yyyyMMddHHmmss")+i+ "_Indicator.gif";
String filePath9 = "businessAnalysis/" + filePathImage9;
String path9=request.getSession().getServletContext().getRealPath("/") + filePath9;
jfreechart9.getTitle().setFont(font);
XYPlot xypt9= (XYPlot)jfreechart9.getPlot();
xypt9.getDomainAxis().setLabelFont(font);
xypt9.getDomainAxis().setTickLabelFont(font);
jfreechart9.getLegend().setItemFont(font);//决绝底部标题中午乱码
xypt9.getRangeAxis().setLabelFont(font);
xypt9.getRangeAxis().setTickLabelFont(font);
XYLineAndShapeRenderer xylineandshaperenderer9 = (XYLineAndShapeRenderer)xypt9.getRenderer();
//设置网格背景颜色
xypt9.setBackgroundPaint(Color.white);
//设置网格竖线颜色
xypt9.setDomainGridlinePaint(Color.pink);
//设置网格横线颜色
xypt9.setRangeGridlinePaint(Color.pink);
//设置曲线图与xy轴的距离
xypt9.setAxisOffset(new RectangleInsets(0D, 0D, 0D, 0D));
//设置曲线是否显示数据点
xylineandshaperenderer9.setBaseShapesVisible(true);
//设置曲线显示各数据点的值
XYItemRenderer xyitem9 = xypt9.getRenderer();
xyitem9.setBaseItemLabelsVisible(true);
xyitem9.setBasePositiveItemLabelPosition(new ItemLabelPosition(ItemLabelAnchor.OUTSIDE12, TextAnchor.BASELINE_LEFT));
xyitem9.setBaseItemLabelGenerator(new StandardXYItemLabelGenerator());
xyitem9.setBaseItemLabelFont(new Font("Dialog", 1, 14));
JfreeChartBuilder.createImage(request, response, path9, jfreechart9, 1.0f, 600, 400);
list.add(filePath9);
//------------------------------------
//访问量统计时间线
TimeSeries timeSeries1 = new TimeSeries("阿蜜果blog访问量统计", "","");
//时间曲线数据集合
TimeSeriesCollection lineDataset8 = new TimeSeriesCollection();
//构造数据集合
timeSeries1.add(new Month(1, 2007), 11200);
timeSeries1.add(new Month(2, 2007), 9000);
timeSeries1.add(new Month(3, 2007), 6200);
timeSeries1.add(new Month(4, 2007), 8200);
timeSeries1.add(new Month(5, 2007), 8200);
timeSeries1.add(new Month(6, 2007), 12200);
timeSeries1.add(new Month(7, 2007), 13200);
timeSeries1.add(new Month(8, 2007), 8300);
timeSeries1.add(new Month(9, 2007), 12400);
timeSeries1.add(new Month(10, 2007), 12500);
timeSeries1.add(new Month(11, 2007), 13600);
timeSeries1.add(new Month(12, 2007), 12500);
lineDataset8.addSeries(timeSeries1);
JFreeChart jfreechart8 = ChartFactory.createTimeSeriesChart("访问量统计时间线", "月份", "访问量", lineDataset8, true, true, true);
XYPlot plot8 = (XYPlot) jfreechart8.getPlot();
XYLineAndShapeRenderer xylineandshaperenderer = (XYLineAndShapeRenderer)plot8.getRenderer();
//设置网格背景颜色
plot8.setBackgroundPaint(Color.white);
//设置网格竖线颜色
plot8.setDomainGridlinePaint(Color.pink);
//设置网格横线颜色
plot8.setRangeGridlinePaint(Color.pink);
//设置曲线图与xy轴的距离
plot8.setAxisOffset(new RectangleInsets(0D, 0D, 0D, 10D));
//设置曲线是否显示数据点
xylineandshaperenderer.setBaseShapesVisible(true);
//设置曲线显示各数据点的值
XYItemRenderer xyitem8 = plot8.getRenderer();
xyitem8.setBaseItemLabelsVisible(true);
xyitem8.setBasePositiveItemLabelPosition(new ItemLabelPosition(ItemLabelAnchor.OUTSIDE12, TextAnchor.BASELINE_LEFT));
xyitem8.setBaseItemLabelGenerator(new StandardXYItemLabelGenerator());
xyitem8.setBaseItemLabelFont(font);
jfreechart8.getLegend().setItemFont(font);//决绝底部标题中午乱码
plot8.setRenderer(xyitem8);
i++;
String filePathImage8 = DateUtil.formatDate2String(new java.util.Date(), "yyyyMMddHHmmss")+i+ "_Indicator.gif";
String filePath8 = "businessAnalysis/" + filePathImage8;
String path8=request.getSession().getServletContext().getRealPath("/") + filePath8;
jfreechart8.getTitle().setFont(font);
XYPlot xypt8= (XYPlot)jfreechart8.getPlot();
xypt8.getDomainAxis().setLabelFont(font);
xypt8.getDomainAxis().setTickLabelFont(font);
xypt8.getRangeAxis().setLabelFont(font);
xypt8.getRangeAxis().setTickLabelFont(font);
JfreeChartBuilder.createImage(request, response, path8, jfreechart8, 1.0f, 500, 300);
list.add(filePath8);
//--------------------------------------------
//访问量统计时间线
TimeSeries timeSeries = new TimeSeries("阿蜜果blog访问量统计", "","");
//时间曲线数据集合
TimeSeriesCollection lineDataset = new TimeSeriesCollection();
//构造数据集合
timeSeries.add(new Month(1, 2007), 11200);
timeSeries.add(new Month(2, 2007), 9000);
timeSeries.add(new Month(3, 2007), 6200);
timeSeries.add(new Month(4, 2007), 8200);
timeSeries.add(new Month(5, 2007), 8200);
timeSeries.add(new Month(6, 2007), 12200);
timeSeries.add(new Month(7, 2007), 13200);
timeSeries.add(new Month(8, 2007), 8300);
timeSeries.add(new Month(9, 2007), 12400);
timeSeries.add(new Month(10, 2007), 12500);
timeSeries.add(new Month(11, 2007), 13600);
timeSeries.add(new Month(12, 2007), 12500);
lineDataset.addSeries(timeSeries);
JFreeChart jfreechart7 = ChartFactory.createTimeSeriesChart("访问量统计时间线", "月份", "访问量", lineDataset, true, true, true);
//设置子标题
TextTitle subtitle = new TextTitle("2007年度", new Font("黑体", Font.BOLD, 12));
jfreechart7.addSubtitle(subtitle);
//设置主标题
jfreechart7.setTitle(new TextTitle("阿蜜果blog访问量统计",font));
jfreechart7.setAntiAlias(true);
jfreechart7.getLegend().setItemFont(font);//决绝底部标题中午乱码
i++;
String filePathImage7 = DateUtil.formatDate2String(new java.util.Date(), "yyyyMMddHHmmss")+i+ "_Indicator.gif";
String filePath7 = "businessAnalysis/"+ filePathImage7;
String path7=request.getSession().getServletContext().getRealPath("/") + filePath7;
jfreechart7.getTitle().setFont(font);
XYPlot xypt= (XYPlot)jfreechart7.getPlot();
xypt.getDomainAxis().setLabelFont(font);
xypt.getDomainAxis().setTickLabelFont(font);
xypt.getRangeAxis().setLabelFont(font);
xypt.getRangeAxis().setTickLabelFont(font);
JfreeChartBuilder.createImage(request, response, path7, jfreechart7, 1.0f, 500, 300);
list.add(filePath7);
if(11==1){
request.setAttribute("list", list);
return mapping.findForward("jfree");
}
//-----------------
//设置数据集
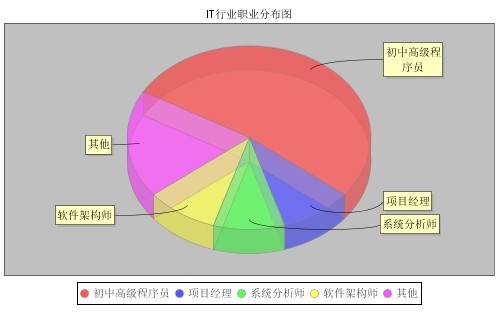
DefaultPieDataset dataset6 = new DefaultPieDataset();
dataset6.setValue("初中高级程序员", 0.55);
dataset6.setValue("项目经理", 0.1);
dataset6.setValue("系统分析师", 0.1);
dataset6.setValue("软件架构师", 0.1);
dataset6.setValue("其他", 0.2);
//通过工厂类生成JFreeChart对象
JFreeChart jfreechart6 = ChartFactory.createPieChart3D("IT行业职业分布图", dataset6, true, true, false);
//获得3D的水晶饼图对象
PiePlot3D pieplot3d = (PiePlot3D) jfreechart6.getPlot();
//设置开始角度
pieplot3d.setStartAngle(150D);
//设置方向为”顺时针方向“
pieplot3d.setDirection(Rotation.CLOCKWISE);
//设置透明度,0.5F为半透明,1为不透明,0为全透明
pieplot3d.setForegroundAlpha(0.5F);
pieplot3d.setNoDataMessage("无数据显示");
i++;
String filePathImage6 = DateUtil.formatDate2String(new java.util.Date(), "yyyyMMddHHmmss")+i+ "_Indicator.gif";
String filePath6 = "businessAnalysis/" + filePathImage6;
String path6=request.getSession().getServletContext().getRealPath("/") + filePath6;
jfreechart6.getLegend().setItemFont(font);//决绝底部标题中午乱码
jfreechart6.getTitle().setFont(font);//决绝顶部标题中午乱码
PiePlot pp = (PiePlot)jfreechart6.getPlot();
pp.setLabelFont(font);
JfreeChartBuilder.createImage(request, response, path6, jfreechart6, 1.0f, 500, 300);
list.add(filePath6);
if(11==1){
request.setAttribute("list", list);
return mapping.findForward("jfree");
}
//---------------
DefaultPieDataset dataset5 = new DefaultPieDataset();
dataset5.setValue("初中高级程序员", 0.55);
dataset5.setValue("项目经理", 0.1);
dataset5.setValue("系统分析师", 0.1);
dataset5.setValue("软件架构师", 0.1);
dataset5.setValue("其他", 0.2);
//通过工厂类生成JFreeChart对象
JFreeChart chart5 = ChartFactory.createPieChart3D("IT行业职业分布图", dataset5, true, false, false);
PiePlot pieplot5 = (PiePlot) chart5.getPlot();
pieplot5.setLabelFont(font);
//没有数据的时候显示的内容
pieplot5.setNoDataMessage("无数据显示");
pieplot5.setCircular(false);
i++;
String filePathImage5 = DateUtil.formatDate2String(new java.util.Date(), "yyyyMMddHHmmss")+i+ "_Indicator.gif";
String afilePath5 = "businessAnalysis/"+ filePathImage5;
String path5=request.getSession().getServletContext().getRealPath("/") + afilePath5;
chart5.getTitle().setFont(font);
chart5.getLegend().setItemFont(font);//决绝底部标题中午乱码
JfreeChartBuilder.createImage(request, response, path5, chart5, 1.0f, 500, 300);
list.add(afilePath5);
//-----------
DefaultPieDataset dataset4 = new DefaultPieDataset();
dataset4.setValue("初中高级程序员", 0.55);
dataset4.setValue("项目经理", 0.1);
dataset4.setValue("系统分析师", 0.1);
dataset4.setValue("软件架构师", 0.05);
dataset4.setValue("其他", 0.2);
//通过工厂类生成JFreeChart对象
JFreeChart jfreechart4 = ChartFactory.createPieChart3D("IT行业职业分布图", dataset4, true, false, false);
PiePlot pieplot = (PiePlot) jfreechart4.getPlot();
pieplot.setLabelFont(font);
//没有数据的时候显示的内容
pieplot.setNoDataMessage("无数据显示");
pieplot.setCircular(false);
pieplot.setLabelGap(0.02D);
i++;
String filePathImage = DateUtil.formatDate2String(new java.util.Date(), "yyyyMMddHHmmss")+i+ "_Indicator.gif";
String afilePath4 = "businessAnalysis/"+ filePathImage;
String path1=request.getSession().getServletContext().getRealPath("/") + afilePath4;
jfreechart4.getTitle().setFont(font);
jfreechart4.getLegend().setItemFont(font);//决绝底部标题中午乱码
JfreeChartBuilder.createImage(request, response, path1, jfreechart4, 1.0f, 500, 300);
list.add(afilePath4);
if(11==1){
request.setAttribute("list", list);
return mapping.findForward("jfree");
}
// ---------------------
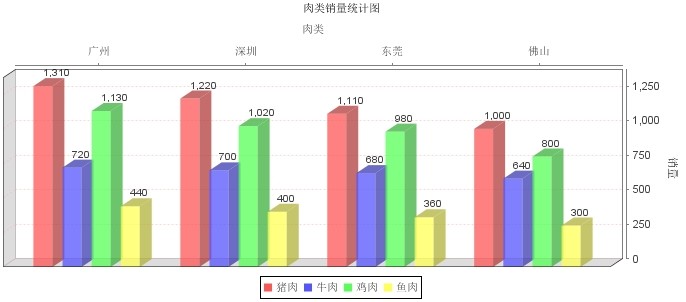
double[][] data3 = new double[][] {{1310, 1220, 1110, 1000},
{720, 700, 680, 640},
{1130, 1020, 980, 800},
{440, 400, 360, 300}};
String[] rowKeys3 = {"猪肉", "牛肉","鸡肉", "鱼肉"};
String[] columnKeys3 = {"广州", "深圳", "东莞", "佛山"};
CategoryDataset dataset3 = DatasetUtilities.createCategoryDataset(rowKeys3, columnKeys3, data3);
JFreeChart jfreechart3 = ChartFactory.createBarChart3D("肉类销量统计图", "肉类", "销量",
dataset3, PlotOrientation.VERTICAL, true, true, false);
CategoryPlot plot = jfreechart3.getCategoryPlot();
//设置网格背景颜色
plot.setBackgroundPaint(Color.white);
//设置网格竖线颜色
plot.setDomainGridlinePaint(Color.pink);
//设置网格横线颜色
plot.setRangeGridlinePaint(Color.pink);
//显示每个柱的数值,并修改该数值的字体属性
BarRenderer3D renderer = new BarRenderer3D();
renderer.setBaseItemLabelGenerator(new StandardCategoryItemLabelGenerator());
renderer.setBaseItemLabelsVisible(true);
//默认的数字显示在柱子中,通过如下两句可调整数字的显示
//注意:此句很关键,若无此句,那数字的显示会被覆盖,给人数字没有显示出来的问题
renderer.setBasePositiveItemLabelPosition(new ItemLabelPosition(ItemLabelAnchor.OUTSIDE12, TextAnchor.BASELINE_LEFT));
renderer.setItemLabelAnchorOffset(10D);
//设置每个地区所包含的平行柱的之间距离
//renderer.setItemMargin(0.3);
plot.setRenderer(renderer);
//设置地区、销量的显示位置
//将下方的“肉类”放到上方
plot.setDomainAxisLocation(AxisLocation.TOP_OR_RIGHT);
//将默认放在左边的“销量”放到右方
plot.setRangeAxisLocation(AxisLocation.BOTTOM_OR_RIGHT);
jfreechart3.getLegend().setItemFont(font);//决绝底部标题中午乱码
String filePath3 = createReportImg(request, response, jfreechart3, i++);
list.add(filePath3);
// ---------------------
double[][] data2 = new double[][] {{1310, 1220, 1110, 1000},
{720, 700, 680, 640},
{1130, 1020, 980, 800},
{440, 400, 360, 300}};
String[] rowKeys2 = {"猪肉", "牛肉","鸡肉", "鱼肉"};
String[] columnKeys2 = {"广州", "深圳", "东莞", "佛山"};
CategoryDataset dataset2 = DatasetUtilities.createCategoryDataset(rowKeys2, columnKeys2, data2);
JFreeChart jfreechart2 = ChartFactory.createBarChart3D("广州肉类销量统计图", "肉类", "销量", dataset2,
PlotOrientation.VERTICAL, true, false, false);
jfreechart2.getLegend().setItemFont(font);//决绝底部标题中午乱码
String filePath2 = createReportImg(request, response, jfreechart2, i++);
list.add(filePath2);
DefaultCategoryDataset dataset = new DefaultCategoryDataset();
dataset.addValue(1210, "广州", "猪肉");
dataset.addValue(20, "广州", "牛肉");
dataset.addValue(130, "广州", "鸡肉");
dataset.addValue(340, "广州", "鱼肉");
JFreeChart jfreechart = ChartFactory.createBarChart3D("肉类销量统计图", "肉类","销量",
dataset,PlotOrientation.VERTICAL, false, false, false);
String filePath = createReportImg(request, response, jfreechart, i++);
list.add(filePath);
// ---------------------
double[][] data = new double[][] {{1310}, {720}, {1130}, {440}};
String[] rowKeys = {"猪肉", "牛肉","鸡肉", "鱼肉"};
String[] columnKeys = {""};
CategoryDataset dataset1 = DatasetUtilities.createCategoryDataset(rowKeys, columnKeys, data);
JFreeChart jfreechart1 = ChartFactory.createBarChart3D("广州肉类销量统计图", "肉类", "销量", dataset1,
PlotOrientation.VERTICAL, true, false, false);
jfreechart1.getLegend().setItemFont(font);//决绝底部标题中午乱码
String filePath1 = createReportImg(request, response, jfreechart1, i++);
list.add(filePath1);
request.setAttribute("list", list);
return mapping.findForward("jfree");
}
private String createReportImg(HttpServletRequest request,
HttpServletResponse response, JFreeChart jfreechart,int i) {
String filePathImage = DateUtil.formatDate2String(new java.util.Date(), "yyyyMMddHHmmss")+i+ "_Indicator.gif";
String filePath = "businessAnalysis/"+ filePathImage;
String path=request.getSession().getServletContext().getRealPath("/") + filePath;
Font font = new Font("sans-serif", Font.PLAIN, 11);
jfreechart.getTitle().setFont(font);
CategoryPlot categoryPort = jfreechart.getCategoryPlot();
CategoryAxis catagoryAxis = categoryPort.getDomainAxis();
catagoryAxis.setTickLabelFont(font);
catagoryAxis.setLabelFont(font);
ValueAxis valueAxis = categoryPort.getRangeAxis();
valueAxis.setTickLabelFont(font);
valueAxis.setLabelFont(font);
JfreeChartBuilder.createImage(request, response, path, jfreechart, 1.0f, 700, 300);
return filePath;
}2

3
4


 1327
1327

 被折叠的 条评论
为什么被折叠?
被折叠的 条评论
为什么被折叠?
 到【灌水乐园】发言


