


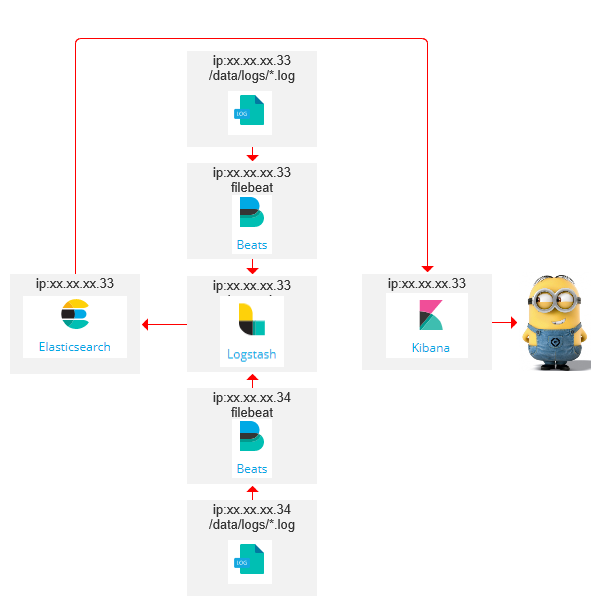
基于 《filebeat+logstash配置搭建 》同一台及其做ELKF,现在做多台filebeat的实践。
自己梳理了下,用了两台服务器33和34,结构如下:(不对的还望指正)
在34服务器解压filebeat修改filebeat.yml配置文件,具体修改《filebeat+logstash配置搭建 》已经记录了,这里在强调下:
启用、配置log目录、注释掉直接输出到elasticsearch的代码、开启输出到logstash的代码并指定logstash的访问ip端口。
#=========================== Filebeat prospectors =============================
  enabled: true
  paths:
    - /data/logs/*.log
#================================ Outputs =====================================
#-------------------------- Elasticsearch output ------------------------------
#output.elasticsearch:
  # Array of hosts to connect to.
 # hosts: ["localhost:9200"]
#----------------------------- Logstash output --------------------------------
output.logstash:
  # The Logstash hosts
  hosts: ["xx.xx.xx.33:5044"]
创建日志文件
[root@pro-lisdb ~]# cat /data/logs/test1.log
dblog1 2017年12月12日 11:10:05 看着星空的状态 dblog1-1
dblog1 2017年12月12日 11:10:30 看着星空的状态 dblog1-2
dblog1 2017年12月12日 11:10:45 看着星空的状态 dblog1-3
守护进程启动,查看日志
[root@pro-lisdb logs]# nohup /ELK/filebeat-6.0.0-linux-x86_64/./filebeat -e -c /ELK/filebeat-6.0.0-linux-x86_64/filebeat.yml >/ELK/logs/filebeat.log 2>&1 &
[1] 6436
[root@pro-lisdb logs]# tail -f /ELK/logs/filebeat.log
2017/12/12 03:12:51.393900 registrar.go:108: INFO Loading registrar data from /ELK/filebeat-6.0.0-linux-x86_64/data/registry
2017/12/12 03:12:51.393936 registrar.go:119: INFO States Loaded from registrar: 0
2017/12/12 03:12:51.393951 filebeat.go:260: WARN Filebeat is unable to load the Ingest Node pipelines for the configured modules because the Elasticsearch output is not configured/enabled. If you have already loaded the Ingest Node pipelines or are using Logstash pipelines, you can ignore this warning.
2017/12/12 03:12:51.393963 crawler.go:44: INFO Loading Prospectors: 1
2017/12/12 03:12:51.394053 registrar.go:150: INFO Starting Registrar
2017/12/12 03:12:51.394282 prospector.go:103: INFO Starting prospector of type: log; id: 8330113223118837052
2017/12/12 03:12:51.394384 crawler.go:78: INFO Loading and starting Prospectors completed. Enabled prospectors: 1
2017/12/12 03:12:51.394421 reload.go:128: INFO Config reloader started
2017/12/12 03:12:51.394554 reload.go:220: INFO Loading of config files completed.
2017/12/12 03:12:51.394648 harvester.go:207: INFO Harvester started for file: /data/logs/test1.log
2017/12/12 03:13:21.390450 metrics.go:39: INFO Non-zero metrics in the last 30s: beat.memstats.gc_next=4194304 beat.memstats.memory_alloc=2898360 beat.memstats.memory_total=4637016 filebeat.events.added=4 filebeat.events.done=4 filebeat.harvester.open_files=1 filebeat.harvester.running=1 filebeat.harvester.started=1 libbeat.config.module.running=0 libbeat.config.reloads=1 libbeat.output.events.acked=3 libbeat.output.events.batches=1 libbeat.output.events.total=3 libbeat.output.read.bytes=6 libbeat.output.type=logstash libbeat.output.write.bytes=348 libbeat.pipeline.clients=1 libbeat.pipeline.events.active=0 libbeat.pipeline.events.filtered=1 libbeat.pipeline.events.published=3 libbeat.pipeline.events.retry=3 libbeat.pipeline.events.total=4 libbeat.pipeline.queue.acked=3 registrar.states.current=1 registrar.states.update=4 registrar.writes=3
前往Kibana查看结果
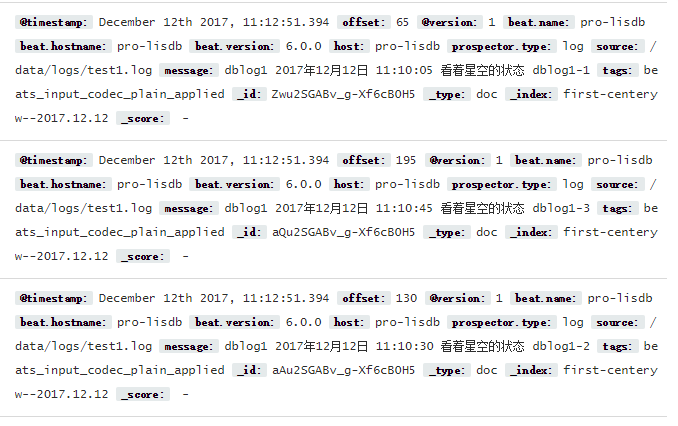
模拟日志追加
[root@pro-lisdb ~]# cat /data/logs/test1.log
dblog1 2017年12月12日 11:10:05 看着星空的状态 dblog1-1
dblog1 2017年12月12日 11:10:30 看着星空的状态 dblog1-2
dblog1 2017年12月12日 11:10:45 看着星空的状态 dblog1-3
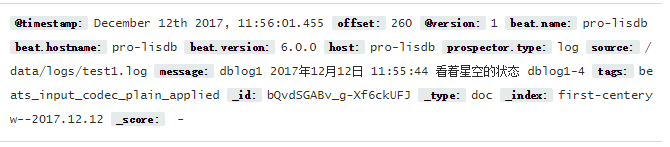
dblog1 2017年12月12日 11:55:44 看着星空的状态 dblog1-4
查看Kibana追加结果
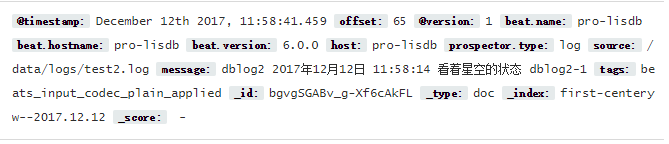
同目录下创建test2.log
[root@pro-lisdb logs]# cat test2.log
dblog2 2017年12月12日 11:58:14 看着星空的状态 dblog2-1
查看filebeat日志,已经读取了test2.log
2017/12/12 03:58:41.459330 harvester.go:207: INFO Harvester started for file: /data/logs/test2.log
2017/12/12 03:58:42.460078 async.go:235: ERR Failed to publish events caused by: write tcp 10.48.4.34:54685->10.48.4.33:5044: write: connection reset by peer
2017/12/12 03:58:43.460224 output.go:92: ERR Failed to publish events: write tcp 10.48.4.34:54685->10.48.4.33:5044: write: connection reset by peer
2017/12/12 03:58:51.390384 metrics.go:39: INFO Non-zero metrics in the last 30s: beat.memstats.gc_next=5782272 beat.memstats.memory_alloc=2912896 beat.memstats.memory_total=15492264 filebeat.events.added=2 filebeat.events.done=2 filebeat.harvester.open_files=2 filebeat.harvester.running=2 filebeat.harvester.started=1 libbeat.config.module.running=0 libbeat.output.events.acked=1 libbeat.output.events.batches=2 libbeat.output.events.failed=1 libbeat.output.events.total=2 libbeat.output.read.bytes=6 libbeat.output.write.bytes=279 libbeat.output.write.errors=1 libbeat.pipeline.clients=1 libbeat.pipeline.events.active=0 libbeat.pipeline.events.filtered=1 libbeat.pipeline.events.published=1 libbeat.pipeline.events.retry=2 libbeat.pipeline.events.total=2 libbeat.pipeline.queue.acked=1 registrar.states.current=2 registrar.states.update=2 registrar.writes=2
查看Kibana结果
结束...
现在只是简单实践测试,为了应对复杂内容的日志文件处理,后续再添加对应规则


 734
734

 被折叠的 条评论
为什么被折叠?
被折叠的 条评论
为什么被折叠?
 到【灌水乐园】发言


