


前言
近来,我们一直都在通过一些开源免费的工具,来帮助中小企业提升其网络威胁检测能力。在本文中,我们将手把手的教大家通过Kibana,Wazuh和Bro IDS来提高自身企业的威胁检测能力。

什么是Wazuh?
Wazuh是一款以OSSEC作为引擎的基于主机的入侵检测系统。通过与ELK的结合,便于管理员通过日志平台查看系统日志信息,告警信息,规则配置信息等。
安装ELK&Wazuh
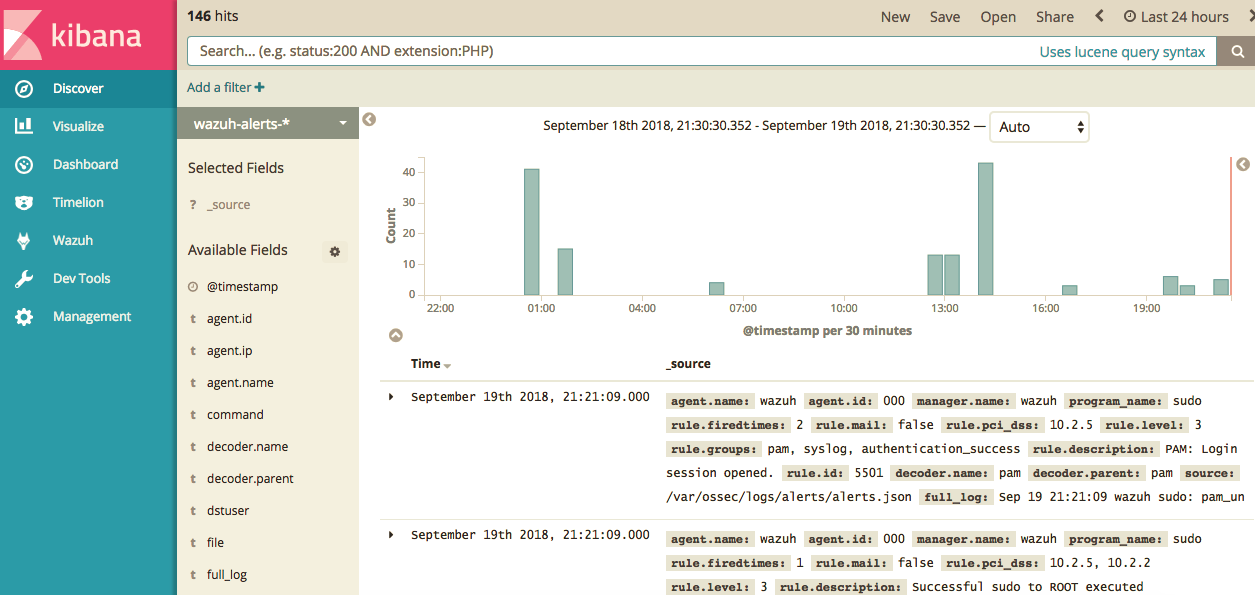
这里有份非常详细的Wazuh官方文档,你可以参考该文档进行安装安装成功后,你可以通过。HTTP:// YOUR_SERVER:5601访问Kibana和Wazuh。
安装兄弟
BRO是一个开源的IDS项目。它的安装相对容易,但使用Kibana进行设置就会复杂许多。我们尝试了好几个网上的安装教程,但都没有成功。所以,我们创建了我们自己的安装指南,你只需重复我们的安装步骤即可(避免在此过程浪费时间)。
Ubuntu安装
默认情况下,Ubuntu的上已安装了Git的。因此,你可以使用以下命令克隆存储库。这些文件将被放入名为兄弟的目录中。
git clone --recursive git://git.bro.org/bro切换到项目目录
cd bro运行兄弟的配置(这个过程应该不到一分钟就能完成)。
./configure
make在运行时,你会在大多数输出行的开头看到完成百分比。
完成后,安装兄弟(这也应该用不到一分钟的时间)。
sudo make install兄弟将被安装在在/ usr /本地/兄弟目录中。
现在我们需要将在/ usr /本地/兄弟目录添加到$ PATH中。要确保它在全局可用,最好的方法是在/etc/profile.d中目录下指定文件中的路径。我们将该文件称为3rd-party.sh。
export PATH=$PATH:/usr/local/bro/bin现在,我们已经安装了兄弟,接下来我们还需要对它进行一些配置更改才能正常运行。
配置兄弟
。这里我们需要对一些兄弟的配置文件进行修改这些文件都位于在/ usr /本地/兄弟的/ etc目录中,主要包含以下三个文件:
node.cfg,用于配置要监视的节点。
networks.cfg,包含节点本地的CIDR表示法网络列表。
broctl.cfg,邮件,日志记录和其他设置的全局BroControl配置文件。
让我们看看每个文件中需要修改的地方。
配置要监控的节点
要配置弟兄的监视节点,我们需要修改node.cfg文件。
开箱即用,兄弟被配置为在独立模式下运行。因为这是独立安装的,所以你不需要修改此文件,但最好是检查下其中的值是否正确。
打开文件进行编辑。
sudo nano /usr/local/bro/etc/node.cfg在布部分,我们找到接口参数。这里的默认值为eth0,这应该与你的Ubuntu 16.04服务器的公共接口相匹配。如果不一致的话,你就要进行修改。
/usr/local/bro/etc/node.cfg
[bro]
type=standalone
host=localhost
interface=eth0
完成后保存并关闭文件。接下来,我们将配置该节点所属的专用网络。
你可以在networks.cfg文件中,配置节点所属的IP网络(即你希望监视的服务器接口的IP网络)。
我们打开该文件。
sudo nano /usr/local/bro/etc/networks.cfg默认情况下,该文件附带三个专用IP地址块示例。
/usr/local/bro/etc/networks.cfg
# List of local networks in CIDR notation, optionally followed by a
# descriptive tag.
# For example, "10.0.0.0/8" or "fe80::/64" are valid prefixes.

10.0.0.0/8          Private IP space
172.16.0.0/12       Private IP space
192.168.0.0/16      Private IP space
删除现有的三个条目,然后添加我们自己的条目。你可以通过ip addr show命令来检查服务器接口的网络地址。你的networks.cfg文件最终应该看起来像下面这样:
示例/usr/local/bro/etc/networks.cfg
192.168.1.0/24          Public IP space
172.16.100.0/24         Private IP space
完成编辑后保存并关闭文件。接下来,我们将配置邮件和日志记录设置。
使用BroControl管理兄弟
BroControl用于管理Bro的安装 - 启动和停止服务,部署Bro以及执行其他管理任务。它既是命令行工具又是一个交互式的shell。
如果使用sudo / usr / local / bro / bin / broctl调用broctl,它将启动一个交互式shell:
Welcome to BroControl 1.5-21

Type "help" for help.

[BroControl] >
你也可以使用退出命令退出交互式外壳。
在外壳中,你可以运行任何有效的弟兄命令。你也可以直接从命令行运行相同的命令,而无需调用壳。在命令行运行命令的一大优势就是,允许你将broctl命令的输出通过管道,传输到标准的Linux命令中。在接下来的部分,我们都将在命令行中调用broctl命令。
首先,我们使用broctl deploy启动Bro。
sudo /usr/local/bro/bin/broctl deploy将弟兄日志转换为JSON
默认情况下,Bro日志是TSV(制表符分隔值)文件!但对于ElasticSearch而言,使用JSON文件可以更高效地运行。
我们只需在/usr/share/bro/share/site/bro.local文件的末尾添加以下内容即可:
@load tuning/json-logs
redef LogAscii::json_timestamps = JSON::TS_ISO8601;
redef LogAscii::use_json = T;
接着,我们重启兄弟。现在,我们所有的日志文件都应该已经转换为了JSON格式。
sudo /usr/local/bro/bin/broctl restartFilebeat
首先,我们将原始的wazuh filebeat配置移动到一个新创建的目录conf.d.你只需复制以下命令即可:
cd /etc/filebeat
mkdir conf.d
mv filebeat.yml conf.d/
cat << EOF > filebeat.yml
filebeat:
  config_dir: /etc/filebeat/conf.d
output:
 logstash:
   # The Logstash hosts
   hosts: ["127.0.0.1:5000"]
EOF
然后,在/etc/filebeat/conf.d/filebeat_bro.yml中创建我们的兄锉文件配置:
filebeat:
 prospectors:
  - input_type: log
    paths:
     - "/usr/local/bro/spool/bro/conn.log"
    document_type: json
    json.message_key: log
    json.keys_under_root: true
    json.overwrite_keys: true

  - input_type: log
    paths:
     - "/usr/local/bro/spool/bro/dns.log"
    document_type: json
    json.message_key: log
    json.keys_under_root: true
    json.overwrite_keys: true

  - input_type: log
    paths:
     - "/usr/local/bro/spool/bro/http.log"
    document_type: json
    json.message_key: log
    json.keys_under_root: true
    json.overwrite_keys: true

  - input_type: log
    paths:
     - "/usr/local/bro/spool/bro/intel.log"
    document_type: json
    json.message_key: log
    json.keys_under_root: true
    json.overwrite_keys: true

# copy inputs to add additional bro logs as needed

output:
 logstash:
   # The Logstash hosts
   hosts: ["127.0.0.1:5001"]
Logstash
我们的Logstash配置/etc/logstash/conf.d/bro.conf:
input {
    beats {
        port => 5001
        codec => "json_lines"
    }
}

filter {

  #Let's get rid of those header lines; they begin with a hash
  if [message] =~ /^#/ {
    drop { }
  }

  #Now, using the csv filter, we can define the Bro log fields
  if [type] == "bro-conn_log" {
    csv {
      columns => ["ts","uid","id.orig_h","id.orig_p","id.resp_h","id.resp_p","proto","service","duration","orig_bytes","resp_bytes","conn_state","local_orig","missed_bytes","history","orig_pkts","orig_ip_bytes","resp_pkts","resp_ip_bytes","tunnel_parents"]

      #If you use a custom delimiter, change the following value in between the quotes to your delimiter. Otherwise, insert a literal <tab> in between the two quotes on your logstash system, use a text editor like nano that doesn't convert tabs to spaces.
      separator => "	"
    }

    #Let's convert our timestamp into the 'ts' field, so we can use Kibana features natively
    date {
      match => [ "ts", "UNIX" ]
    }

    # add geoip attributes
    geoip {
      source => "id.orig_h"
      target => "orig_geoip"
    }
    geoip {
      source => "id.resp_h"
      target => "resp_geoip"
    }

    #The following makes use of the translate filter (logstash contrib) to convert conn_state into human text. Saves having to look up values for packet introspection
    translate {
      field => "conn_state"

      destination => "conn_state_full"

      dictionary => [
                    "S0", "Connection attempt seen, no reply",
                    "S1", "Connection established, not terminated",
                    "S2", "Connection established and close attempt by originator seen (but no reply from responder)",
                    "S3", "Connection established and close attempt by responder seen (but no reply from originator)",
                    "SF", "Normal SYN/FIN completion",
                    "REJ", "Connection attempt rejected",
                    "RSTO", "Connection established, originator aborted (sent a RST)",
                    "RSTR", "Established, responder aborted",
                    "RSTOS0", "Originator sent a SYN followed by a RST, we never saw a SYN-ACK from the responder",
                    "RSTRH", "Responder sent a SYN ACK followed by a RST, we never saw a SYN from the (purported) originator",
                    "SH", "Originator sent a SYN followed by a FIN, we never saw a SYN ACK from the responder (hence the connection was 'half' open)",
        "SHR", "Responder sent a SYN ACK followed by a FIN, we never saw a SYN from the originator",
                    "OTH", "No SYN seen, just midstream traffic (a 'partial connection' that was not later closed)"
                    ]
    }

    mutate {
      convert => [ "id.orig_p", "integer" ]
      convert => [ "id.resp_p", "integer" ]
      convert => [ "orig_bytes", "integer" ]
      convert => [ "duration", "float" ]
      convert => [ "resp_bytes", "integer" ]
      convert => [ "missed_bytes", "integer" ]
      convert => [ "orig_pkts", "integer" ]
      convert => [ "orig_ip_bytes", "integer" ]
      convert => [ "resp_pkts", "integer" ]
      convert => [ "resp_ip_bytes", "integer" ]
      rename =>  [ "id.orig_h", "id_orig_host" ]
      rename =>  [ "id.orig_p", "id_orig_port" ]
      rename =>  [ "id.resp_h", "id_resp_host" ]
      rename =>  [ "id.resp_p", "id_resp_port" ]
    }
  }
}

output {
  #stdout { codec => rubydebug }
  elasticsearch {
        hosts => ["localhost:9200"]
        index => "bro-conn-%{+YYYY.MM.dd}"
        document_type => "bro"
        template => "/etc/logstash/bro.json"
        template_name => "bro"
        template_overwrite => true
  }
}我们的bro.json文件你可以在这里获取到:https://gist.github.com/netscylla/27ac9e1472d89dffa5a8267a6af9c9be
最后,我们重启logstash。
systemctl restart logstash并检查你的Kibana仪表板:
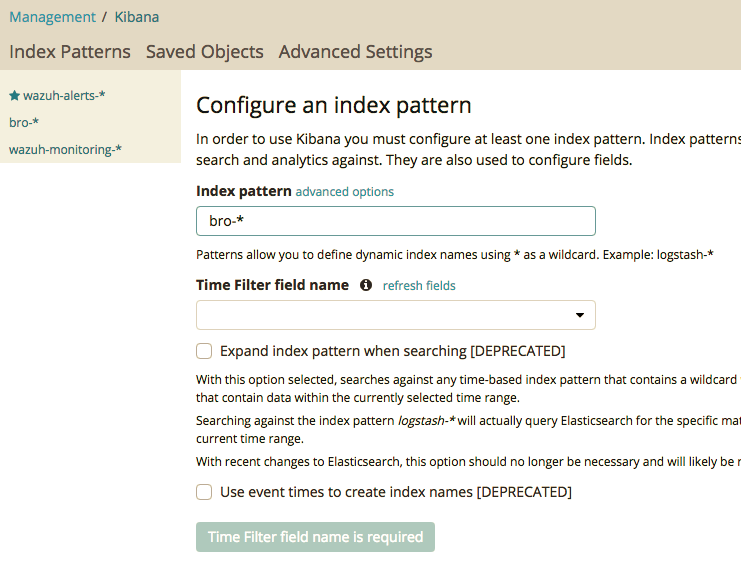
首先,我们转到管理面板,然后单击索引模式(index patterns),这将告诉kibana你的兄文件的位置,如下所示:
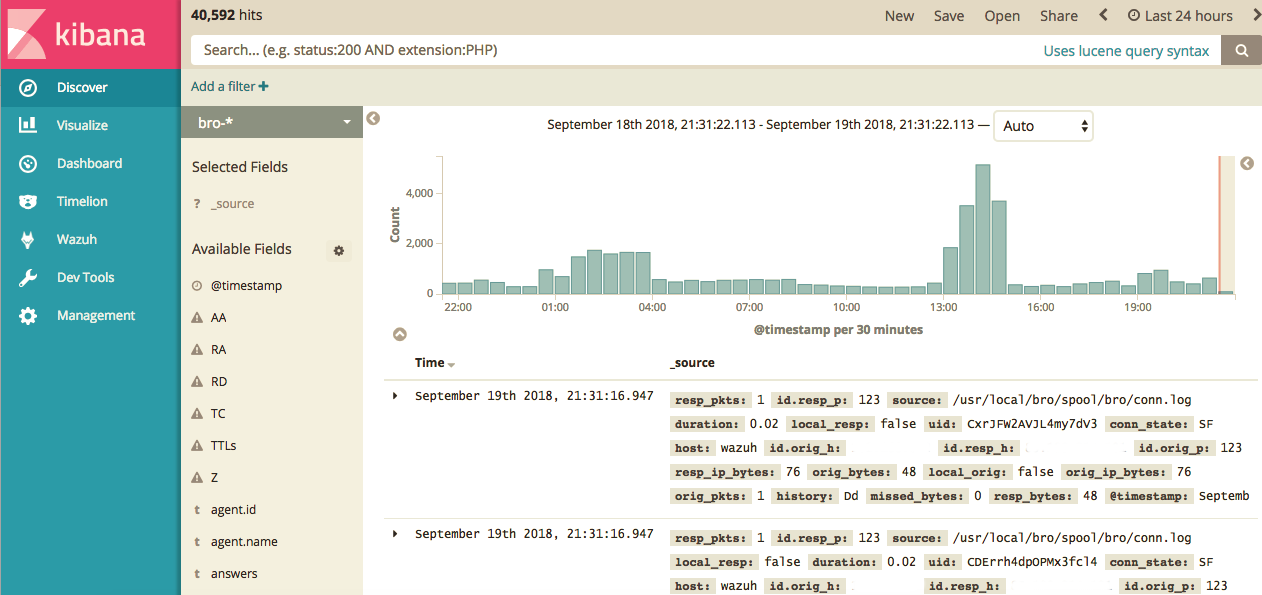
然后回到探索,你应该能够看到你的兄弟日志!
提取 - Bro和威胁情报
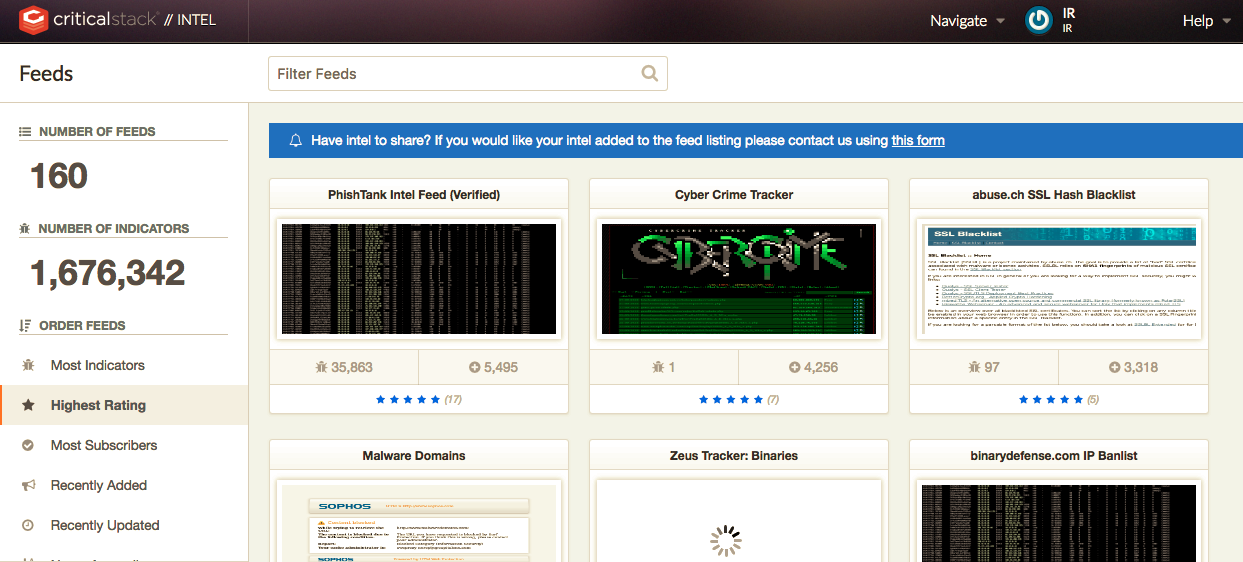
首先,在我们这里进行注册以免费电子杂志情报威胁源。
选择你的容器,饲料和传感器(见以下的饲料截图)。
你将看到一个api code,我们将其复制到剪贴板或记事本中。
遵循临界堆叠英特尔二进制文件的客户端安装说明进行安装:
然后使用api code(需要联网)将二进制文件连接到feed,此时它应该下载已订阅的威胁情报源。
critical-stack-intel api [api_code_here]并重启兄弟
sudo /usr/local/bro/bin/broctl restart使用以下命令列出提要:
critical-stack-intel list结语
希望通过本文的学习,能够让你轻松的按照我们的说明来创建你自己的HIDS和NIDS监控系统,并进一步的提升你们企业的威胁检测能力。


 224
224

 被折叠的 条评论
为什么被折叠?
被折叠的 条评论
为什么被折叠?
 到【灌水乐园】发言


