


承接上文:pandas:参照列属性将一行转换为多行-时间精度分片
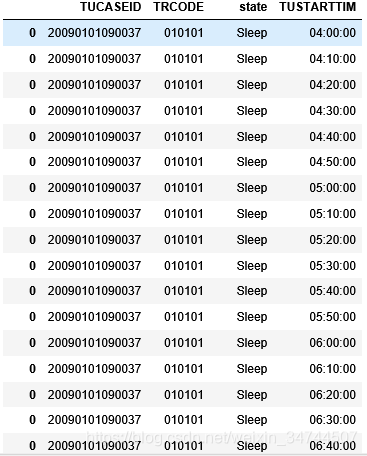
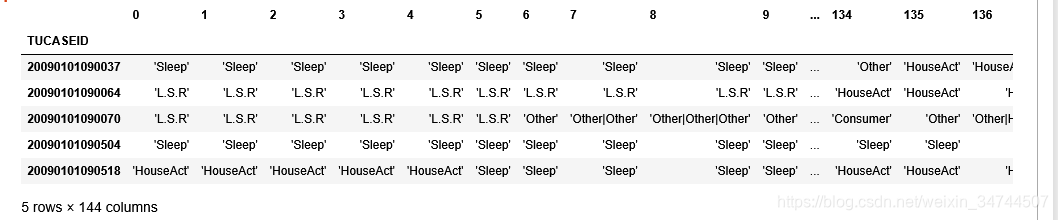
将时间分片后打算将图一转换为图二的效果,即将每个人的一天的状态按一天144个10分钟去分成144列
注意:某些人的某个时间段可能会有多个活动,因为某些活动少于10分钟的原因
代码如图:(可处理出图二)
#将活动表按照144个10分钟分组,活动类型按"|"划分
dt = DataTable.groupby(['TUCASEID','TUSTARTTIM']).apply(lambda x:['|'.join(x['state'])])
#Seriers转dataframe
dt2= dt.to_frame()
dt2.rename(columns={0:'STATE'},inplace=True)
#字符串相加为列表
dt3 = dt.groupby(['TUCASEID']).sum()
#Seriers转dataframe,的到每个ID的一行(一行有一个144的list)
dt4 = dt3.to_frame()
dt4.rename(columns={0:'STATE'},inplace=True)
#list转str然后去除'[]'
dt4['STATE'] = dt4['STATE'].apply(lambda x:str(x).strip('[]'))
#按,分割成多列(outer以防万一)
dt4 = dt4['STATE'].str.split(',',expand=True)
#去除左右空格
dt4 = dt4.applymap(lambda x: str(x).strip())
dt4.head()
关键在于groupby的用法,groupby使你能以一种自然的方式对数据集进行切片、切块、摘要等操作。根据一个或多个键(可以是函数、数组或DataFrame列名)拆分pandas对象。
操作groupby后,groupby括号后里的属性不会重复(可以组合索引)。
groupby后可以使用系统函数sum(),mean()等,也可以使用自定义函数去对数据分组。
得到状态转移矩阵:
#获取第Index个十分钟到第Index+1个分钟的状态转移矩阵
def GetCounts(Index):
    TimeRow = dt4.iloc[:,Index:Index+2]
    Act_list = ['Sleep','HouseAct','WithChild','Work','Educaton','Consumer','L.S.R','Other']
    #总人数1
    test_sum = 0
    for x in Act_list:
        test_sum+= len(TimeRow[TimeRow[Index].str.contains(x)])

    #总人数2
    peo_sum = 0
    for x in Act_list:
        for y in Act_list:
            peo_sum+= len(TimeRow[(TimeRow[Index].str.contains(x)) & (TimeRow[Index+1]).str.contains(y)])

    Big_Temp_list = list()
    for x in Act_list:
        Temp_list = list()
        testpeonum = len(TimeRow[TimeRow[Index].str.contains(x)])
        #每个状态的比例
        testpro = testpeonum/test_sum

        for y in Act_list:
            peonum = len(TimeRow[(TimeRow[Index].str.contains(x)) & (TimeRow[Index+1]).str.contains(y)])
            #状态一到状态二的概率
            Proportion = peonum / peo_sum if peonum != 0 else 0
            #状态一到状态二的概率 / 状态一的概率
            finalpro = Proportion / testpro if Proportion != 0 else 0
            Temp_list.append(finalpro)
        Big_Temp_list.append(Temp_list)

    #STARTTIME = datetime.datetime.strptime('04:00:00','%H:%M:%S') + datetime.timedelta(minutes = Index * 10)
    #ENDTIME = datetime.datetime.strptime('04:00:00','%H:%M:%S') + datetime.timedelta(minutes = (Index+1) * 10)
    #STARTTIME = STARTTIME.strftime('%H:%M:%S')
    #ENDTIME = ENDTIME.strftime('%H:%M:%S')
    #print('时刻: '+STARTTIME+'  TO  '+ENDTIME)
    Matrix = np.array(Big_Temp_list)
    return Matrix
可以看出使用两个循环可以获得一个8*8的状态转移矩阵
至于如何计算状态转移矩阵:
下面介绍一步转移概率矩阵的实现方法:
1.首先计算每一种状态的概率

2.计算m时刻状态为ai,m+1时刻状态为aj的概率

3.计算转移概率

举个例子,有一个序列X= {a,c,a,c,a,b,d,b};
1.首先它的状态空间为I = {a,b,c,d},计算每一种状态的概率 p(a) = 3/8,p(b) = 2/8,p(c) = 2/8,p(d) = 1/8;
2.计算m时刻状态为ai且m+1时刻状态为aj的概率,比如,计算当前时刻为a下一时刻为c的转移概率
由于举的例子状态数比较少很容易知道 p = 1/4;
3.经过上面的计算就可以得出转移概率p(a->c) = p/p(a) = 2/3.
如果上面的过程不好理解,可以用古典概型来计算,为了求p(a->c)可以分别求出当前状态为a时
下一状态为b、c、d的次数:
a->a 0次; a->b 1次;a->c 2次;a->d 0次;
p(a->c)=2/(0+1+2+0)=2/3
为了更好的理解,下面给出序列X的一步转移概率矩阵

以上求解转移矩阵参考此博客,详细可以了解此博客:https://blog.csdn.net/sinat_35821976/article/details/77094935
另外:求时间状态分布图 (关键字:matplotlib堆叠直方图)
import time
from tqdm import tqdm
from tqdm._tqdm import trange
import matplotlib.pyplot as plt
import numpy as np
import matplotlib
def GetPeoCount(Index):
    TimeRow = dt4.iloc[:,Index:Index+1]
    Act_list = ['Sleep','HouseAct','WithChild','Work','Educaton','Consumer','L.S.R','Other']
    #总人数
    peo_sum = 0
    for x in Act_list:
        #总人数:
        peo_sum+= len(TimeRow[(TimeRow[Index].str.contains(x))])
    Temp_list = list()
    for x in Act_list:
        pro= len(TimeRow[(TimeRow[Index].str.contains(x))])/peo_sum
        Temp_list.append(pro)

    return Temp_list

def GetList(x):
    Temp_list = list()
    for i in tqdm(range(144)):
        num_list1 = GetPeoCount(i)
        pro = GetPeoCount(i)[x]
        Temp_list.append(pro)
    return Temp_list


def GetMatp():
    matplotlib.rcParams['font.sans-serif'] = ['SimHei']
    matplotlib.rcParams['axes.unicode_minus'] = False
    plt.figure(figsize=(20, 15))
    temp_list = list()
    for i in range(8):
        temp_list.append(GetList(i))


    list1 = list(temp_list[0])
    list2 = list(temp_list[1])
    list3 = list(temp_list[2])
    list4 = list(temp_list[3])
    list5 = list(temp_list[4])
    list6 = list(temp_list[5])
    list7 = list(temp_list[6])

    cum1 =list(map(sum, zip(list1,list2)))
    cum2 =list(map(sum, zip(list1,list2,list3)))
    cum3 =list(map(sum, zip(list1,list2,list3,list4)))
    cum4 =list(map(sum, zip(list1,list2,list3,list4,list5)))
    cum5 =list(map(sum, zip(list1,list2,list3,list4,list5,list6)))
    cum6 =list(map(sum, zip(list1,list2,list3,list4,list5,list6,list7)))

    plt.bar(left=range(0, 144), height=temp_list[0], width=2.2, color='salmon', label="Sleep")
    plt.bar(left=range(0, 144), height=temp_list[1], width=2.2, color='orange', label="HouseAct", bottom=temp_list[0])
    plt.bar(left=range(0, 144), height=temp_list[2], width=2.2, color='gold', label="WithChild", bottom=cum1)
    plt.bar(left=range(0, 144), height=temp_list[3], width=2.2, color='greenyellow', label="Work", bottom=cum2)
    plt.bar(left=range(0, 144), height=temp_list[4], width=2.2, color='limegreen', label="Educaton", bottom=cum3)
    plt.bar(left=range(0, 144), height=temp_list[5], width=2.2, color='mediumaquamarine', label="Consumer", bottom=cum4)
    plt.bar(left=range(0, 144), height=temp_list[6], width=2.2, color='deepskyblue', label="L.S.R", bottom=cum5)
    plt.bar(left=range(0, 144), height=temp_list[7], width=2.2, color='blue', label="Other", bottom=cum6)

    plt.ylabel("百分比")
    plt.xlabel("时间(单位:10分钟)")
    plt.title("时间活动分布图")
    plt.legend()
    plt.show()


GetMatp()
注意:导入tqdm包,可视化进度条


 665
665


 被折叠的 条评论
为什么被折叠?
被折叠的 条评论
为什么被折叠?
 到【灌水乐园】发言


