


Read a hyperspectral data into the workspace.
hcube = hypercube('indian_pines.dat');
Compute 10 principal component bands of hyperspectral data and the associated transformation coefficients.
[outputDataCube,coeff] = hypermnf(hcube,10);
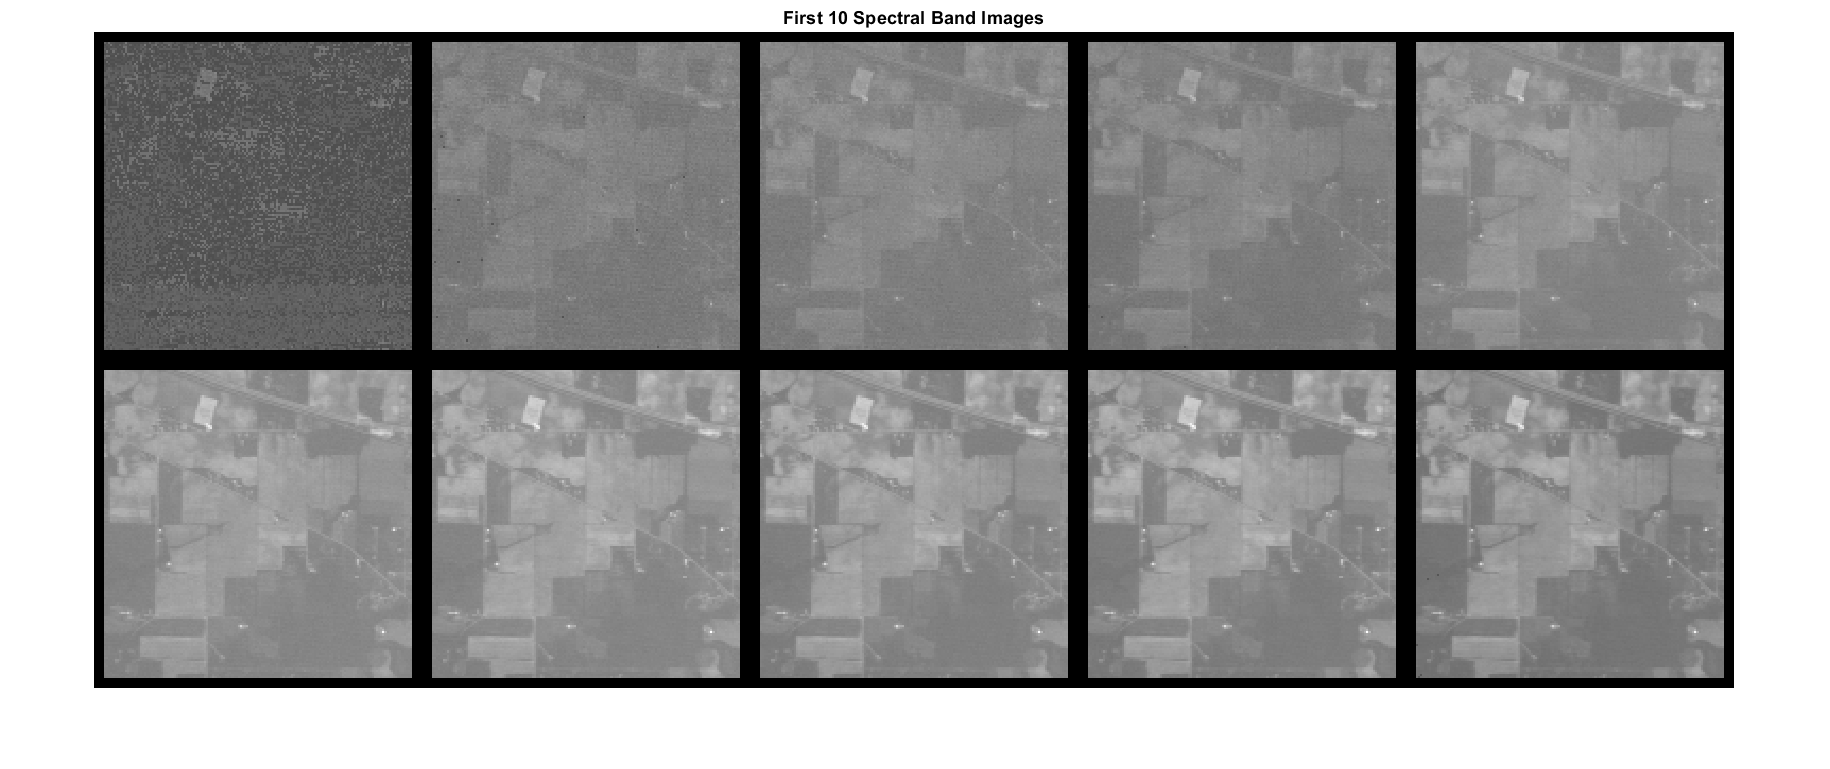
Display the first 10 spectral bands in input data cube.
figure
montage(hcube.DataCube(:,:,1:10),'BorderSize',[10 10],'Size',[2 5],'DisplayRange',[]);
title('First 10 Spectral Band Images')
For the purpose of visualization, rescale the principal component values to lie in the range [0, 1]. Display all the principal component bands extracted from the data cube. The principal component bands are arranged in the order of decreasing image quality (or increasing noise level).
figure
rescalePC = rescale(outputDataCube,0,1);
montage(rescalePC,'BorderSize',[10 10],'Size',[2 5]);
title('Principal Component Bands of Data Cube')


 3万+
3万+


 被折叠的 条评论
为什么被折叠?
被折叠的 条评论
为什么被折叠?
 到【灌水乐园】发言


