


目的
统计运行APP自动化过程中设备的信息数据情况
方案
使用mobileperf来进行性能数据的采集
Android 性能稳定性测试工具 mobileperf 开源 (天猫精灵 Android 性能测试-线下篇)
数据采集实现
将mobileperf中各个采集类放到代码中/src/utils/perf,对其中的配置读取部分进行适当的修改,适配当前框架中的配置读取
启动数据采集
编写一个session级别的fixture去启动与停止
@pytest.fixture(scope="session", autouse=True)
def performance():
    """
    统计设备cpu情况
    @return:
    """
    if "127.0.0.1" in REMOTE_URL:
        app = "com.greenline.guahao"
        t = timeoperator.strftime_now("%Y_%m_%d_%H_%M_%S")
        frequency = 5

        cpu_monitor = CpuMonitor(UDID, [app], frequency)
        traffic_monitor = TrafficMonitor(UDID, [app], frequency)
        fps_monitor = FPSMonitor(UDID, app, frequency)
        mem_monitor = MemMonitor(UDID, [app], frequency)
        power_monitor = PowerMonitor(UDID, frequency)
        thread_num_monitor = ThreadNumMonitor(UDID, app, frequency)

        cpu_monitor.start(t)
        traffic_monitor.start(t)
        fps_monitor.start(t)
        mem_monitor.start(t)
        power_monitor.start(t)
        thread_num_monitor.start(t)
        yield
        cpu_monitor.stop()
        traffic_monitor.stop()
        fps_monitor.stop()
        mem_monitor.stop()
        power_monitor.stop()
        thread_num_monitor.stop()
        try:
            r = ReportOperator(hook=ROBOT.split(','))
            d = DataOperator()
            r.send_msg(d.all_handle())
        except Exception as e:
            logger.error(e)
        FileOperator.rename_folder(PERF_PATH, os.path.join(REPORT_PATH, f'perf_{timeoperator.now4}'))
    else:
        logger.error("执行手机与电脑直连才进行性能数据统计")
        yield
数据展示实现
重新实现对数据的读取与展示
以CPU数据处理为例:
读取csv文件
删除pid为空的数据
去除重复写入的表头
留下要展示的数据并转化为float类型
时间列设置为
datetime类型
def cpu_handle(self, path=f"{PERF_PATH}/cpuinfo.csv"):
    df = self.read_csv(path)
    # 去除pid列为空的数据
    df = df.dropna(axis=0, how="any", subset=["pid"])
    df.drop(df[(df.datetime == "datetime")].index, inplace=True)
    df = pd.DataFrame(df, columns=['datetime', 'device_cpu_rate%', 'user%', 'system%', 'idle%', 'pid_cpu%'])
    for i in ['device_cpu_rate%', 'user%', 'system%', 'idle%', 'pid_cpu%']:
        df[i] = df[i].astype(float)
    df['datetime'] = pd.to_datetime(df['datetime'])
    return df
其他数据处理方式类似
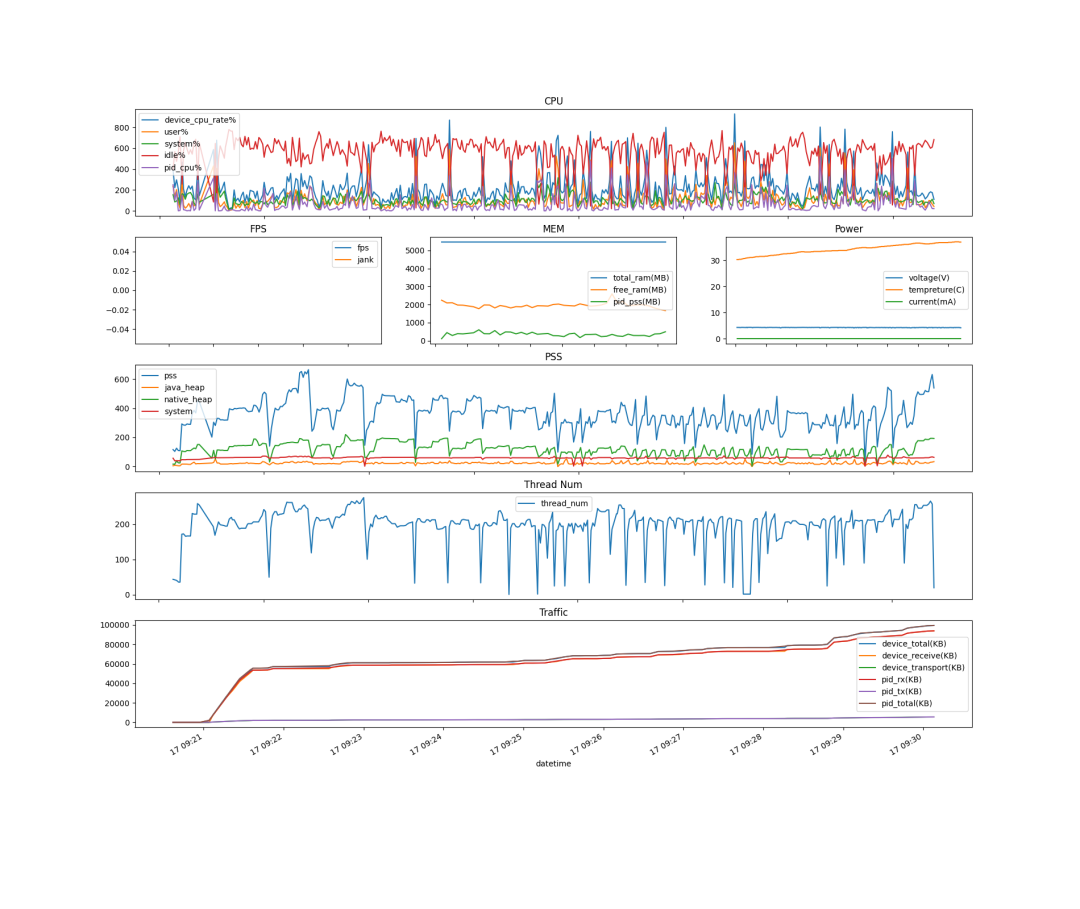
处理完之后将它们展示在一张图上
设置画布大小为1900*1600
设置字体大小
设置画布布局为5行,3列
将数据放到对应画布上
存为一张图片
def all_handle(self, new_path=f"{PERF_PATH}/all.png"):
    df1 = self.cpu_handle()
    df2 = self.fps_handle()
    df3 = self.mem_handle()
    df4 = self.power_handle()
    df5 = self.pss_handle()
    df6 = self.thread_num_handle()
    df7 = self.traffic_handle()
    plt.figure(1, figsize=(19, 16))
    plt.text(3, 12, 'I', fontsize=20)
    gs = gridspec.GridSpec(5, 3)
    ax1 = plt.subplot(gs[0, :])
    ax2 = plt.subplot(gs[1, 0])
    ax3 = plt.subplot(gs[1, 1])
    ax4 = plt.subplot(gs[1, 2])
    ax5 = plt.subplot(gs[2, :])
    ax6 = plt.subplot(gs[3, :])
    ax7 = plt.subplot(gs[4, :])
    ax1.axes.xaxis.set_ticklabels([])
    ax2.axes.xaxis.set_ticklabels([])
    ax3.axes.xaxis.set_ticklabels([])
    ax4.axes.xaxis.set_ticklabels([])
    ax5.axes.xaxis.set_ticklabels([])
    ax6.axes.xaxis.set_ticklabels([])
    df1.plot(x="datetime", kind="line", title="CPU", ax=ax1, xlabel="")
    df2.plot(x="datetime", kind="line", title="FPS", ax=ax2, xlabel="")
    df3.plot(x="datatime", kind="line", title="MEM", ax=ax3, xlabel="")
    df4.plot(x="datetime", kind="line", title="Power", ax=ax4, xlabel="")
    df5.plot(x="datatime", kind="line", title="PSS", ax=ax5, xlabel="")
    df6.plot(x="datatime", kind="line", title="Thread Num", ax=ax6, xlabel="")
    df7.plot(x="datetime", kind="line", title="Traffic", ax=ax7)
    # plt.show()
    plt.savefig(new_path)
    return f"[性能数据]({new_path})\n"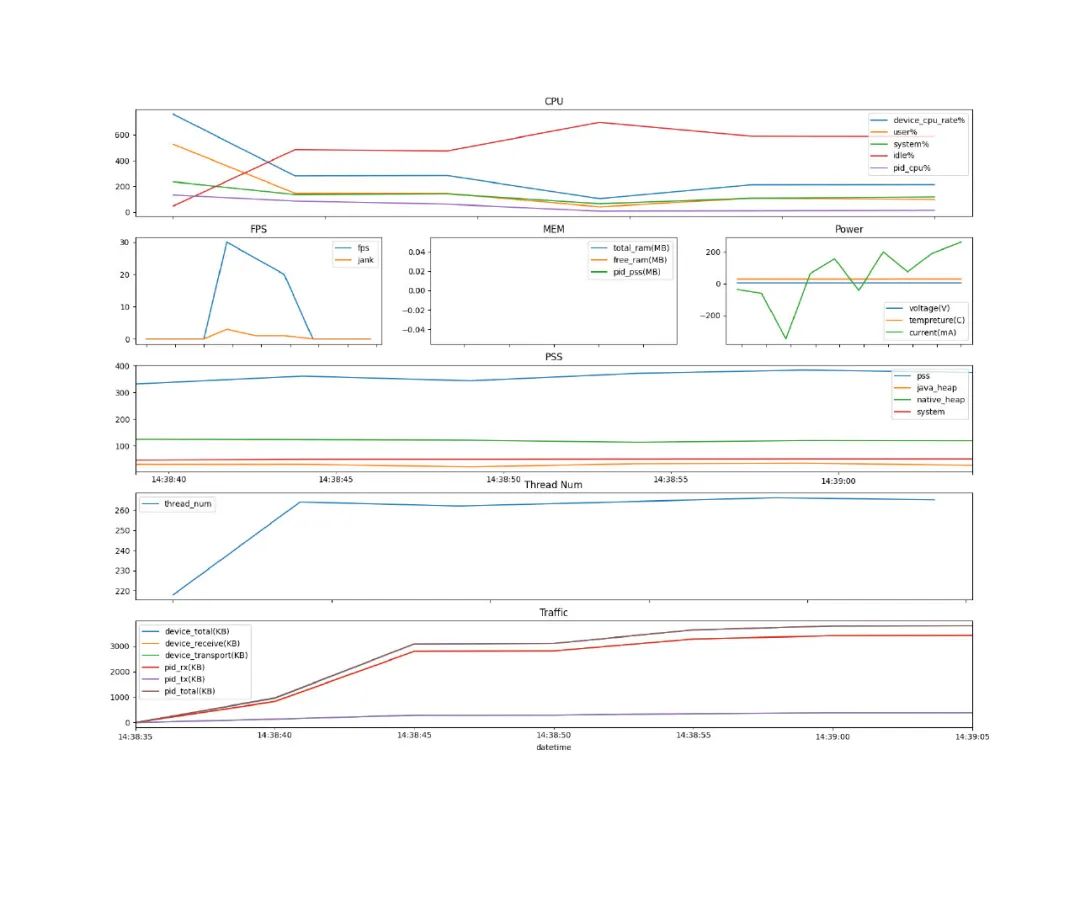
名词解析
CPU
top
device_cpu_rate:整机CPU使用率
user%:用户态CPU使用率
system%:内核态CPU使用率
idle%:空闲CPU
pid_cpu%:测试对象进程的CPU
FPS(流畅度)
dumpsys SurfaceFlinger 或 dumpsys gfxinfo
fps:帧数
jank:丢帧数,掉帧(丢10帧算一次严重丢帧)
MEM(内存)
adb shell dumpsys meminfo [pkg]
total_ram:设备总内存
free_ram:可用内存
pid_pss:测试对象进程的内存
Power(能耗)(不准确)
dumpsys batteryproperties
dumpsys battery
voltage:电压
tempreture:温度
current:电流(0表示没获取到)
PSS
adb shell dumpsys meminfo [pkg] 可以用来查看指定进程包名的内存使用情况
pss:实际使用的物理内存
java_heap:java的堆内存
native_heap:其他的堆内存
system
android程序内存被分为2部分:native和dalvik,dalvik就是java堆,普通java对象是在java堆分配,而bitmap是直接在native上分配,对于内存的限制是 native+dalvik 不能超过最大限制。
Thread Num(线程数)
Traffic(网络流量)
读取/proc/net/xt_qtaguid/stats
device_total:设备总流量
device_receive:设备接收
device_transport:设备传输
pid_rx:上行流量
pid_tx:下行流量
pid_total:总流量
代码
https://gitee.com/zx660644/uitest


 1109
1109


 被折叠的 条评论
为什么被折叠?
被折叠的 条评论
为什么被折叠?
 到【灌水乐园】发言


