


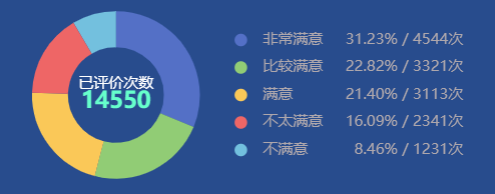
效果图:
直接上代码:
<template>
 <el-container>
   <div id="pieChart" style="width:500px;height:200px"></div>
 </el-container>
</template>

<script>
export default {
mounted(){
   this.drawPie();
 },
 methods: {
  //饼状图
   drawPie(){
     let pieOption=this.$echarts.init(document.getElementById('pieChart'))
     var pieData=[
           {value:4544,name:'非常满意'},
           {value:3321,name:'比较满意'},
           {value:3113,name:'满意'},
           {value:2341,name:'不太满意'},
           {value:1231,name:'不满意'}
         ]
     var pieCount=14550
     var option={
       tooltip:{
         trigger:'none'
       },
       legend:{
           type:'plain',
           show:true,
           orient:'vertical',
           right:10,
           top:'25%',
           bottom:'20%',
           icon:'circle',
           itemHeight:10,
           align:'left',
           padding:[0,0,10,0],
           width:'50%',
           textStyle:{
             color:'#aea7ac',
             fontSize:16,
             overflow:'truncate',
             width:160,
             rich:{
                a:{
                  align:'left'
                },
                b:{
                  align:'right',
                },
              }
           },
           formatter(name){
             const count=pieCount
             const val= pieData.filter(item=>{
               return item.name===name
             })
            return '{a|'+name+' '+'}'+'{b|'+((val[0].value/count)*100).toFixed(2)+'% / '+val[0].value+'次}'
           },
         },
       series:[{
         name:'',
         type:'pie',
         radius:['40%','70%'],
         avoidLabelOverlap:false,
         label:{
           show:false
         },
         width:'50%',
         data: pieData,
         label:{//饼图图像文本标签
           position:'center',
           formatter: function(){
             let count=pieCount;
             let str='{a|已评价次数}'+"\n"+'{b|'+count+'}';
            return str;
           },
           rich:{//富文本样式
             a:{
               color:'#fff'
             },
             b:{
               color:'#66FFCC',
               fontWeight:'bold',
               fontSize:'18px'
             }
           }

         },
       }]
     }
     pieOption.setOption(option)
   }
 }
}
</script>


 266
266


 被折叠的 条评论
为什么被折叠?
被折叠的 条评论
为什么被折叠?
 到【灌水乐园】发言


