


为啥监控ssl请求时间
公司服务在云环境下,nginx的负载使用的是云上负载,但未配置https证书托管,而是将证书放到负载后端的每台nginx上,nginx也未做ssl证书相关优化,所以当并发达到一定量时,可能会出现某一台nginx服务器ssl请求非常慢。
每次解决需要绑定hosts去curl每一个节点,才能判断出哪台有问题。
为了快速报警哪台服务器ssl握手慢,所以采用监控方式进行探测及告警。
最开始使用了三台服务器对三台nginx进行hosts绑定,然后编写py脚本进行告警,目的能达到,但时很不方便,所以想到用docker容器进行hosts绑定,通过prometheus调用的方式采集结果。
域名:https://www.aaa.com
nginx服务器:192.168.100.1 192.168.100.2
环境:docker + python
安装模块:
pip install prometheus_client
pip install flask
探测脚本:
# cat nginx-ssl-check.py


import os
import re
import prometheus_client
from prometheus_client import Gauge
from flask import Response, Flask

app = Flask(__name__)

SSL = Gauge('SSL_handshake', 'SSL_handshake')

@app.route("/metrics")
def ssl_handshake():
    num = os.popen('curl -w "TCP handshake: %{time_connect}, SSL handshake: %{time_appconnect}\n" -so /dev/null https://www.aaa.com/').read()
    SSL_handshake = re.findall(r"SSL handshake: (.+)", num)
    f_SSL = float(SSL_handshake[0])
    SSL.set(f_SSL)
    return Response(prometheus_client.generate_latest(SSL), mimetype="text/plain")


if __name__ == "__main__":
    app.run(host="0.0.0.0", port=8000)
启动运行后,访问
# curl http://localhost:8000/metrics
结果如下
# HELP SSL_handshake SSL_handshake
# TYPE SSL_handshake gauge
SSL_handshake 0.124363 这个就是ssl的请求时间
使用docker启动
先构建一个镜像,安装模块
# cat Dockerfile
FROM python:3.9.13

RUN /usr/local/bin/python -m pip install --upgrade pip
RUN pip3 install prometheus_client
RUN pip3 install flask

CMD python3 /data/nginx-ssl-check.py
构建镜像
docker build -t promehtues_flask_py:v1 .
将上面的python脚本放到服务器目录中,这样是为了多个容器可以同时使用一个脚本
脚本目录:
/data/prometheus_dir/nginx_ssl_check/nginx-ssl-check.py
启动容器:
docker run -d \
-p 8000:8000 \
--name nginx-ssl-check-192.168.100.1 \
--restart=always \
--restart=on-failure:5 \
--add-host www.aaa.com:192.168.100.1 \
-v /data/prometheus_dir/nginx_ssl_check/nginx-ssl-check.py:/data/nginx-ssl-check.py \
promehtues_flask_py:v1


docker run -d \
-p 8001:8000 \
--name nginx-ssl-check-192.168.100.2 \
--restart=always \
--restart=on-failure:5 \
--add-host www.aaa.com:192.168.100.2 \
-v /data/prometheus_dir/nginx_ssl_check/nginx-ssl-check.py:/data/nginx-ssl-check.py \
promehtues_flask_py:v1
注意容器中需要绑定hosts,用于探测对应主机的ssl,而不是负载的方式探测,负载方式是无法知道当前是哪一台nginx的ssl返回慢的。
测试一下:
curl http://localhost:8000/metrics
curl http://localhost:8001/metrics
prometheus集成:
# nginx ssl 握手时间检测
  - job_name: nginx_ssl_check-192.168.100.1
    scrape_interval: 5s
    static_configs:
      - targets: ['192.168.100.200:8000']
        labels:
          instance: nginx-ssl-check-192.168.100.1

  - job_name: nginx_ssl_check-192.168.100.2
    scrape_interval: 5s
    static_configs:
      - targets: ['192.168.100.200:8001']
        labels:
          instance: nginx-ssl-check-192.168.100.2
重启prometheus

告警:
# cat rules/nginx_ssl_check-rules.yaml
groups:
- name: nginx-ssl请求-监控告警
rules:
- alert: ssl请求告警
expr: SSL_handshake > 3
for: 0m
labels:
severity: warning
status: 非常严重
annotations:
summary: "ssl请求:{{$.Labels.instance}}超过3秒"
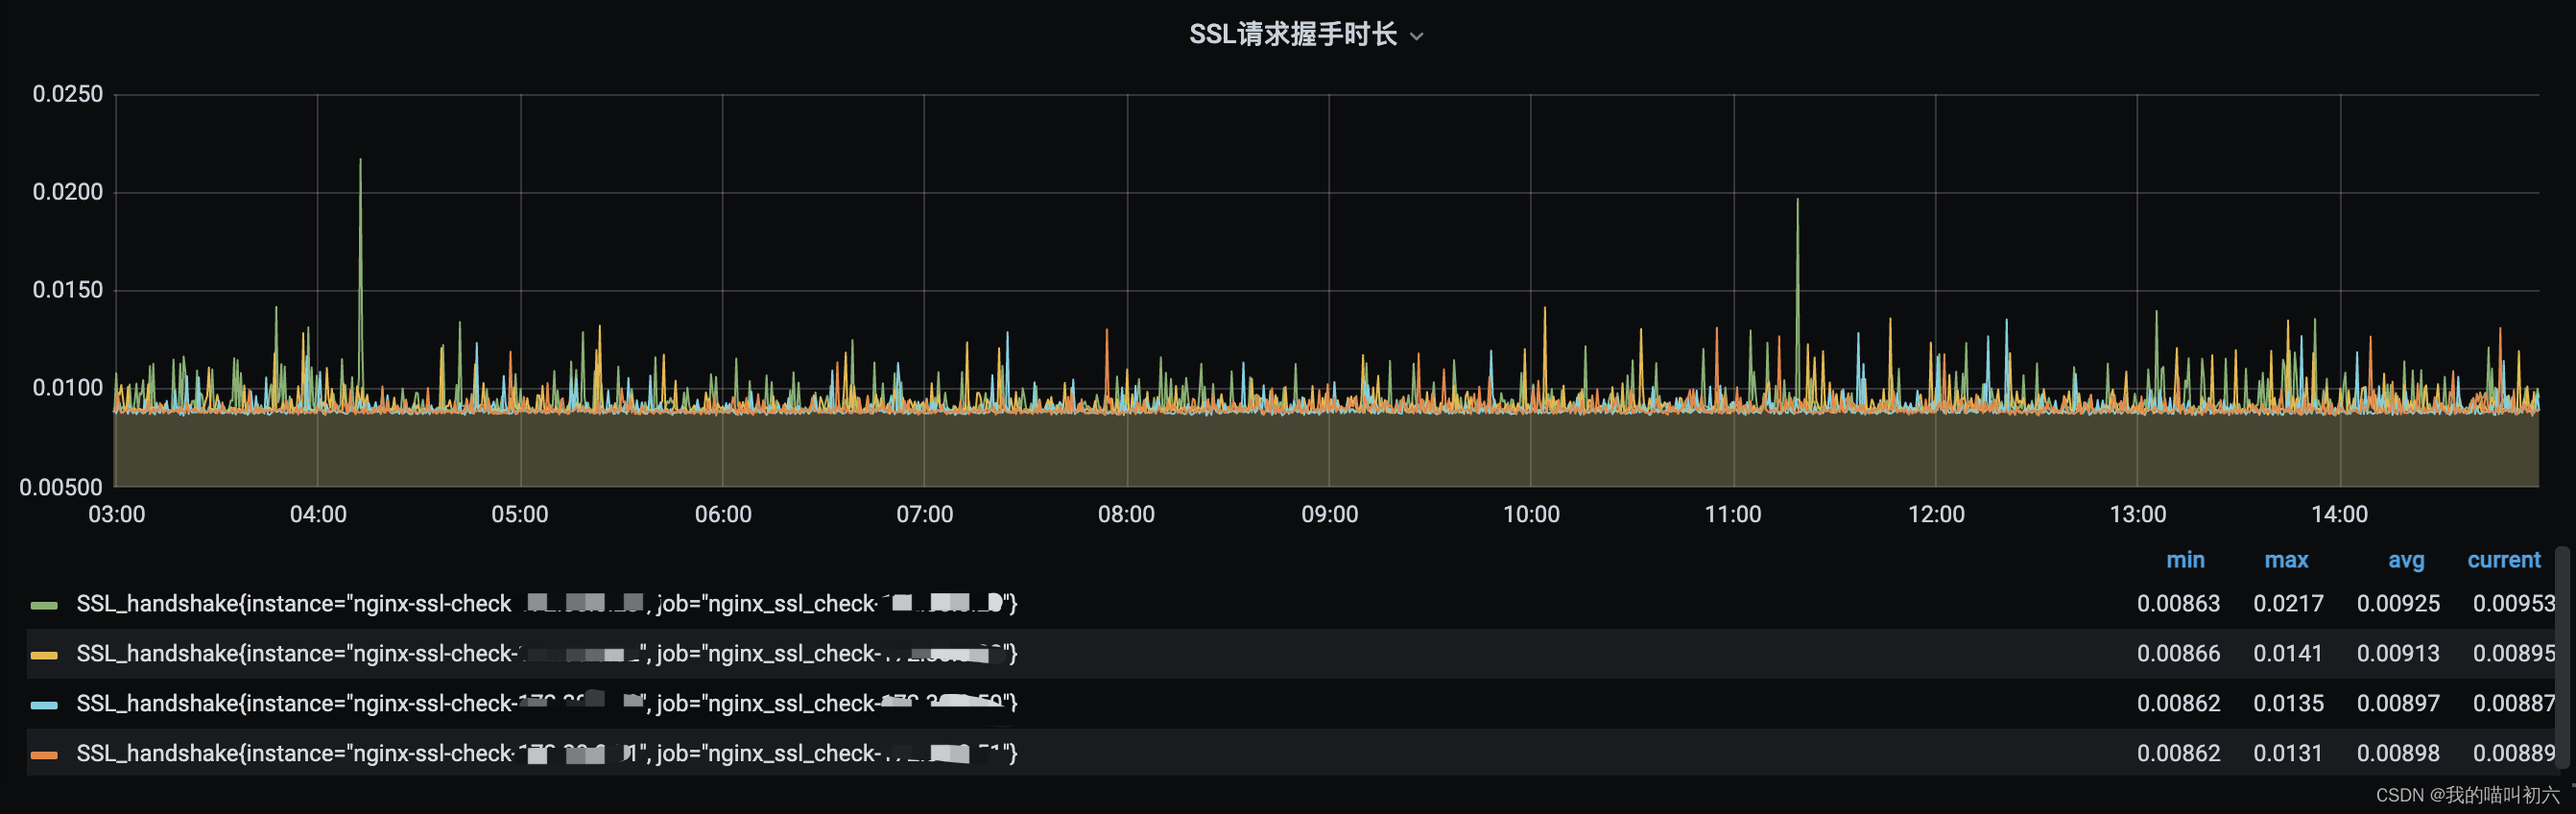
description: "ssl请求:{{$.Labels.instance}}---超过3秒,(当前:{{$value}})"图形展示


 1402
1402


 被折叠的 条评论
为什么被折叠?
被折叠的 条评论
为什么被折叠?
 到【灌水乐园】发言


