


echarts 实现 3d 柱状图
柱状图
实现要求
- 能够调整大小
- 实现3d效果,可以改变颜色
前置环境
vue: ^3.1.2
echarts: ^5.3.3
lodash: ^4.17.21
效果
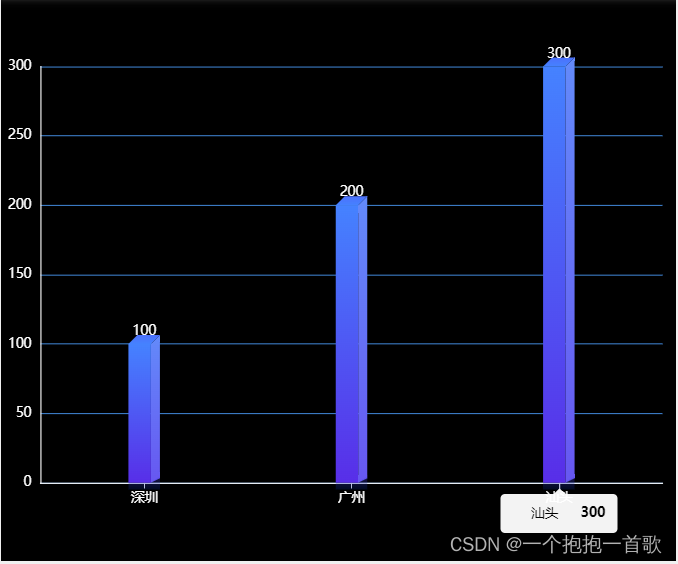
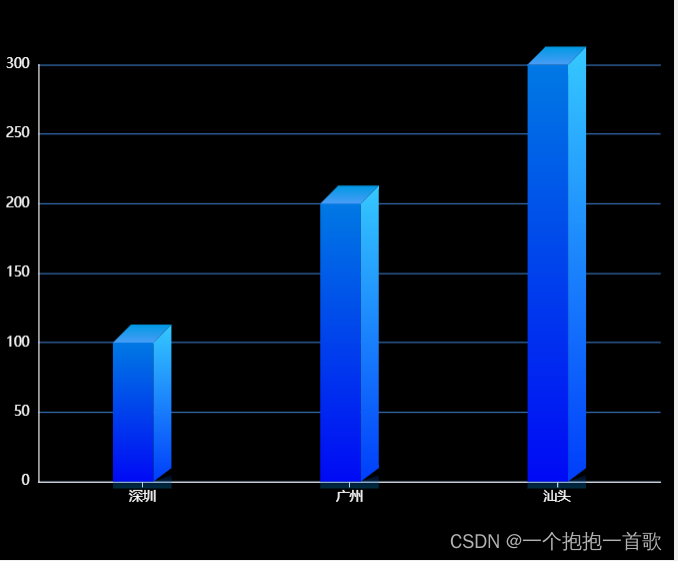
调整大小和颜色
代码
baseCharts.vue
<template>
  <div
    id="baseBarCharts"
    ref="echartsRef"
  ></div>
</template>
<script>
import { onMounted, ref } from "vue"
import * as echarts from 'echarts'
import _ from 'lodash'
export default {
  name: "barCharts",
  setup () {
    let baseEcharts = null
    let echartsRef = ref(null)
    let linearArr = [
      "#0079e4 ",
      "#000af5 ",
      "#36c9ff ",
      "#003efa",
      "#0099e4",
      "#4a9df7",
      "rgba(0, 31, 117, 0.3)",
      "rgba(0, 153, 228, 0.3)",
    ]
    function threeDimensionalLine (offsetX = 20, sliderWidth = 8, offsetTick = 14) {
      // 绘制左侧面
      const CubeLeft = echarts.graphic.extendShape({
        shape: {
          x: 0,
          y: 0,
        },
        buildPath: function (ctx, shape) {
          // 会canvas的应该都能看得懂,shape是从custom传入的
          const xAxisPoint = shape.xAxisPoint
          const c0 = [shape.x - offsetTick, shape.y]
          const c1 = [shape.x - offsetTick + offsetX, shape.y]
          const c2 = [xAxisPoint[0] - offsetTick + offsetX, xAxisPoint[1]]
          const c3 = [xAxisPoint[0] - offsetTick, xAxisPoint[1]]
          ctx
            .moveTo(c0[0], c0[1])
            .lineTo(c1[0], c1[1])
            .lineTo(c2[0], c2[1])
            .lineTo(c3[0], c3[1])
            .closePath()
        },
      })
      // 绘制右侧面
      const CubeRight = echarts.graphic.extendShape({
        shape: {
          x: 0,
          y: 0,
        },
        buildPath: function (ctx, shape) {
          const xAxisPoint = shape.xAxisPoint
          const c1 = [shape.x - offsetTick + offsetX, shape.y]
          const c2 = [shape.x - offsetTick + offsetX + sliderWidth, shape.y - sliderWidth]
          const c3 = [
            xAxisPoint[0] - offsetTick + offsetX + sliderWidth,
            xAxisPoint[1] - sliderWidth + 4,
          ]
          const c4 = [shape.x - offsetTick + offsetX, xAxisPoint[1]]
          ctx
            .moveTo(c1[0], c1[1])
            .lineTo(c2[0], c2[1])
            .lineTo(c3[0], c3[1])
            .lineTo(c4[0], c4[1])
            .closePath()
        },
      })
      // 绘制顶面
      const CubeTop = echarts.graphic.extendShape({
        shape: {
          x: 0,
          y: 0,
        },
        buildPath: function (ctx, shape) {
          const c1 = [shape.x - offsetTick, shape.y]
          const c2 = [shape.x - offsetTick + offsetX, shape.y] // 右点
          const c3 = [shape.x - offsetTick + offsetX + sliderWidth, shape.y - sliderWidth]
          const c4 = [shape.x - offsetTick + sliderWidth, shape.y - sliderWidth]
          ctx
            .moveTo(c1[0], c1[1])
            .lineTo(c2[0], c2[1])
            .lineTo(c3[0], c3[1])
            .lineTo(c4[0], c4[1])
            .lineTo(c1[0], c1[1])
            .closePath()
        },
      })

      const CubeBottom = echarts.graphic.extendShape({
        shape: {
          x: 0,
          y: 0,
        },
        buildPath: function (ctx, shape) {
          const xAxisPoint = shape.xAxisPoint
          const c1 = [xAxisPoint[0] - offsetTick, xAxisPoint[1]]
          const c2 = [xAxisPoint[0] - offsetTick, xAxisPoint[1] + 6] // 右点
          const c3 = [xAxisPoint[0] - offsetTick + offsetX + sliderWidth, xAxisPoint[1] + 6]
          const c4 = [xAxisPoint[0] - offsetTick + offsetX + sliderWidth, xAxisPoint[1] - 6]
          const c5 = [xAxisPoint[0] - offsetTick + offsetX, xAxisPoint[1]]
          ctx
            .moveTo(c1[0], c1[1])
            .lineTo(c2[0], c2[1])
            .lineTo(c3[0], c3[1])
            .lineTo(c4[0], c4[1])
            .lineTo(c5[0], c5[1])
            .lineTo(c1[0], c1[1])
            .closePath()
        },
      })
      // 注册三个面图形
      echarts.graphic.registerShape("CubeLeft", CubeLeft)
      echarts.graphic.registerShape("CubeRight", CubeRight)
      echarts.graphic.registerShape("CubeTop", CubeTop)
      echarts.graphic.registerShape("CubeBottom", CubeBottom)
    }
    let defalutOptions = ref({
      textStyle: {
        fontFamily: "PingFang",
      },
      grid: {
        top: "12%",
        left: "1%",
        right: "2%",
        bottom: "10%",
        containLabel: true,
      },
      xAxis: {
        type: "category",
        data: [],
        axisLine: {
          lineStyle: {
            color: "#fff",
          },
        },
        axisTick: {
          alignWithLabel: true,
        },
      },
      yAxis: {
        type: "value",
        axisLine: {
          show: true,
          lineStyle: {
            color: "#fff",
          },
        },
        splitLine: {
          lineStyle: {
            color: "#3a79c2",
          },
        },
      },
      tooltip: {
        show: true,
        position: "bottom",
        backgroundColor: "#fff",
        textStyle: {
          color: "#000",
          //   fontStyle: "PingFang",
          fontSize: 12,
          //   fontWeight: "normal",
          lineHeight: 24,
        },
      },
      series: [
        {
          type: "custom",
          renderItem: (params, api) => {
            const location = api.coord([api.value(0), api.value(1)])
            return {
              type: "group",
              children: [
                {
                  type: "CubeLeft",
                  shape: {
                    api,
                    xValue: api.value(0),
                    yValue: api.value(1),
                    x: location[0],
                    y: location[1],
                    xAxisPoint: api.coord([api.value(0), 0]),
                  },
                  style: {
                    fill: new echarts.graphic.LinearGradient(0, 0, 0, 1, [
                      {
                        offset: 0,
                        color: linearArr[0],
                      },
                      {
                        offset: 1,
                        color: linearArr[1],
                      },
                    ]),
                  },
                },
                {
                  type: "CubeRight",
                  shape: {
                    api,
                    xValue: api.value(0),
                    yValue: api.value(1),
                    x: location[0],
                    y: location[1],
                    xAxisPoint: api.coord([api.value(0), 0]),
                  },
                  style: {
                    fill: new echarts.graphic.LinearGradient(0, 0, 0, 1, [
                      {
                        offset: 0,
                        color: linearArr[2],
                      },
                      {
                        offset: 1,
                        color: linearArr[3],
                      },
                    ]),
                  },
                },
                {
                  type: "CubeTop",
                  shape: {
                    api,
                    xValue: api.value(0),
                    yValue: api.value(1),
                    x: location[0],
                    y: location[1],
                    xAxisPoint: api.coord([api.value(0), 0]),
                  },
                  style: {
                    fill: new echarts.graphic.LinearGradient(0, 0, 0, 1, [
                      {
                        offset: 0,
                        color: linearArr[4],
                      },
                      {
                        offset: 1,
                        color: linearArr[5],
                      },
                    ]),
                  },
                },
                {
                  type: "CubeBottom",
                  shape: {
                    api,
                    xValue: api.value(0),
                    yValue: api.value(1),
                    x: location[0],
                    y: location[1],
                    xAxisPoint: api.coord([api.value(0), 0]),
                  },
                  style: {
                    fill: new echarts.graphic.LinearGradient(0, 0, 0, 1, [
                      {
                        offset: 0,
                        color: linearArr[6],
                      },
                      {
                        offset: 1,
                        color: linearArr[7],
                      },
                    ]),
                  },
                },
              ],
            }
          },
          data: [],
        },

        {
          type: "bar",
          label: {
            normal: {
              show: true,
              position: "top",
              fontSize: 12,
              color: "#fff",
            },
          },
          itemStyle: {
            color: "transparent",
          },
          data: [],
        },
      ],
    })
    onMounted(() => {
      baseEcharts = echarts.init(echartsRef.value)
      window.addEventListener(
        "resize",
        _.debounce(() => {
          baseEcharts.resize()
        }, 150)
      )
    })
    function setOptions (options, linerArrOptions, barWidth = {}) {
      linearArr = linerArrOptions
      if (barWidth.offsetX && barWidth.sliderWidth) {
        threeDimensionalLine(
          barWidth.offsetX,
          barWidth.sliderWidth,
          (barWidth.offsetX + barWidth.sliderWidth) / 2
        )
      } else {
        threeDimensionalLine()
      }
      baseEcharts.setOption(options, true)
    }
    return {
      echartsRef,
      setOptions,
      defalutOptions,
    }
  },
}
</script>
<style lang="scss" scoped>
#baseBarCharts {
  width: 100%;
  height: 100%;
}
</style>
使用
<template>
  <div style="width:600px;height:500px;background-color: #000;">
    <base-charts ref="baseChartsRef"></base-charts>
  </div>
  <br />
  <div style="width:600px;height:500px;background-color: #000;">
    <base-charts ref="baseChartsRefPlus"></base-charts>
  </div>
</template>

<script>
import baseCharts from "@/components/baseCharts.vue";
import { onMounted, ref } from 'vue';
export default {
  name: "basecharts",
  components: {
    baseCharts,
  },
  setup () {
    const baseChartsRef = ref(null)
    const baseChartsRefPlus = ref(null)
    onMounted(() => {
      let { defalutOptions, setOptions } = baseChartsRef.value
      defalutOptions.xAxis.data = ['深圳', '广州', '汕头']
      defalutOptions.series[0].data = [100, 200, 300]
      defalutOptions.series[1].data = [100, 200, 300]
      setOptions(defalutOptions, [
        "#4582ff", // 正面颜色渐变
        "#582ee8", // 正面颜色渐变
        "#638afa", // 侧面颜色渐变
        "#6757f1", // 侧面颜色渐变
        "#4c70fc", // 顶部颜色渐变
        "#4582ff", // 顶部颜色渐变
        "rgba(90,75,246,0.3)", // 底部颜色渐变
        "rgba(0,31,117,0.3)" // 底部颜色渐变
      ]);
      // 大小可调整
      baseChartsRefPlus.value.defalutOptions.xAxis.data = ['深圳', '广州', '汕头']
      baseChartsRefPlus.value.defalutOptions.series[0].data = [100, 200, 300]
      baseChartsRefPlus.value.defalutOptions.series[0].data = [100, 200, 300]
      baseChartsRefPlus.value.setOptions(baseChartsRefPlus.value.defalutOptions, [
        "#0079e4", // 正面颜色渐变
        "#000af5", // 正面颜色渐变
        "#36c9ff", // 侧面颜色渐变
        "#003efa", // 侧面颜色渐变
        "#0099e4", // 顶部颜色渐变
        "#4a9df7", // 顶部颜色渐变
        "rgba(0,31,117,0.3)", // 底部颜色渐变
        "rgba(0,153,228,0.3)" // 底部颜色渐变
      ], { offsetX: 36, sliderWidth: 16 }) // 正面宽度 , 侧面宽度

    })
    return {
      baseChartsRef,
      baseChartsRefPlus
    };
  },
};
</script>

<style scoped>
.schart-box {
  display: inline-block;
  margin: 20px;
}
.schart {
  width: 600px;
  height: 400px;
}
.content-title {
  clear: both;
  font-weight: 400;
  line-height: 50px;
  margin: 10px 0;
  font-size: 22px;
  color: #1f2f3d;
}
</style>
10.12 更新
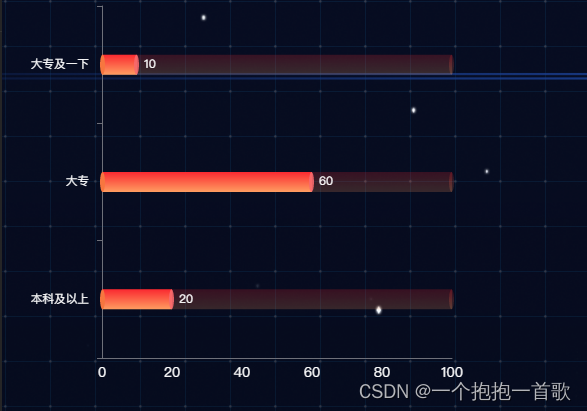
横行柱状图
效果
代码
<template>
  <div id="charts" ref="echartsRef"></div>
</template>
<script>
import { onMounted, ref } from "vue"

export default {
  name: "baseLine",
  props: {
    isneedPercent: {
      type: Boolean,
      default: false,
    },
  },
  setup(props) {
    let baseEcharts = null
    let echartsRef = ref(null)
    let linearArr = [
      "#f7763f",
      "#fa2a31",
      "#ff9d61",
      "#fa2a31",
      "#ff9d61",
      "rgba(247,105,109,0.9)",
      "#fa2a31",
      "#ff9d61",
    ]
    let defalutOptions = ref({
      textStyle: {
        fontFamily: "PingFang",
        fontSize: 16,
      },
      tooltip: {
        trigger: "item",
        valueFormatter: value => (props.isneedPercent ? value + "%" : value),
      },
      grid: {
        top: "2%",
        left: "20%",
        bottom: "10%",
      },
      xAxis: {
        axisTick: {
          show: false,
        },
        axisLine: {
          show: true,
        },
        splitLine: {
          show: false,
        },
        axisLabel: {
          interval: 0,
          textStyle: {
            color: "#fff",
            fontSize: 14,
          },
          formatter: props.isneedPercent ? "{value}%" : "{value}",
        },
      },
      yAxis: {
        data: [],
        splitLine: {
          show: false,
        },
        axisTick: {
          show: true,
        },
        axisLine: {
          show: true,
        },
        axisLabel: {
          textStyle: {
            color: "#fff",
            fontSize: 12,
            padding: [0, 5, 0, 0],
          },
        },
      },
      series: [
        // 最左边顶部
        {
          name: "",
          type: "pictorialBar",
          symbolSize: [5, 20],
          symbolOffset: [-2, 0],
          z: 12,
          itemStyle: {
            opacity: 1,
            color: linearArr[0],
          },
          data: [1, 1, 1, 1, 1],
          tooltip: {
            show: false,
          },
        },
        {
          name: "2020",
          type: "bar",
          barWidth: 20,
          barGap: "-100%",
          itemStyle: {
            //lenged文本
            opacity: 1,
            color: new echarts.graphic.LinearGradient(
              0,
              0,
              0,
              1,
              [
                {
                  offset: 0,
                  color: linearArr[1], // 0% 处的颜色
                },
                {
                  offset: 1,
                  color: linearArr[2], // 100% 处的颜色
                },
              ],
              false
            ),
          },
          label: {
            formatter: props.isneedPercent ? "{c} %" : "{c}",
          },
          data: [],
        },
        {
          type: "bar",
          barWidth: 20,
          barGap: "-100%",
          itemStyle: {
            color: "transparent",
          },
          label: {
            formatter: props.isneedPercent ? "{c} %" : "{c}",
          },
          data: [],
        },
        {
          name: "", //头部
          type: "pictorialBar",
          symbolSize: [5, 20],
          symbolOffset: [2, 0],
          z: 12,
          symbolPosition: "end",
          itemStyle: {
            color: new echarts.graphic.LinearGradient(
              0,
              0,
              0,
              1,
              [
                {
                  offset: 0,
                  color: linearArr[3], // 0% 处的颜色
                },
                {
                  offset: 1,
                  color: linearArr[4], // 100% 处的颜色
                },
              ],
              false
            ),
            opacity: 0.2,
          },
          label: {
            formatter: props.isneedPercent ? "{c} %" : "{c}",
          },
          data: [100, 100, 100, 100, 100, 100],
          tooltip: {
            show: false,
          },
        },
        {
          name: "",
          type: "pictorialBar",
          symbolSize: [5, 20],
          symbolOffset: [2, 0],
          z: 12,
          itemStyle: {
            opacity: 1,
            color: linearArr[5],
          },
          symbolPosition: "end",
          data: [],
          tooltip: {
            show: false,
          },
          label: {
            show: true,
            position: "right",
            fontSize: 12,
            color: "#fff",
            formatter: props.isneedPercent ? "{c} %" : "{c}",
          },
        },
        {
          name: "all",
          type: "bar",
          barWidth: 20,
          barGap: "-100%",
          z: 0,
          itemStyle: {
            color: new echarts.graphic.LinearGradient(
              0,
              0,
              0,
              1,
              [
                {
                  offset: 0,
                  color: linearArr[6], // 0% 处的颜色
                },
                {
                  offset: 1,
                  color: linearArr[7], // 100% 处的颜色
                },
              ],
              false
            ),
            opacity: 0.2,
          },
          label: {
            formatter: props.isneedPercent ? "{c} %" : "{c}",
          },
          data: [100, 100, 100, 100, 100, 100],
          tooltip: {
            show: false,
          },
        },
      ],
    })

    onMounted(() => {
      baseEcharts = echarts.init(echartsRef.value)
      window.addEventListener(
        "resize",
        _.debounce(() => {
          baseEcharts.resize()
        }, 150)
      )
      // baseEcharts.setOption(defalutOptions.value)
    })
    function setOptions(options, colors) {
      options.series[0].itemStyle.color = colors[0]
      options.series[1].itemStyle.color.colorStops = [
        { offset: 0, color: colors[1] },
        { offset: 1, color: colors[2] },
      ]
      options.series[3].itemStyle.color.colorStops = [
        { offset: 0, color: colors[3] },
        { offset: 1, color: colors[4] },
      ]
      options.series[4].itemStyle.color = colors[5]
      options.series[5].itemStyle.color.colorStops = [
        { offset: 0, color: colors[6] },
        { offset: 1, color: colors[7] },
      ]
      baseEcharts.setOption(options, true)
    }
    return {
      echartsRef,
      setOptions,
      defalutOptions,
    }
  },
}
</script>
<style lang="scss" scoped>
#charts {
  width: 100%;
  height: 100%;
}
</style>
使用
<template>
  <div>
    <pipeBar ref="pipeBarRef" style="width: 500px; height: 400px"></pipeBar>
  </div>
</template>
<script>
import { onMounted, ref } from "vue"
import pipeBar from "@/components/echarts/pipeBar"

export default {
  setup() {
    let pipeBarRef = ref(null)
    onMounted(() => {
      let { setOptions, defalutOptions } = pipeBarRef.value
      defalutOptions.series[1].data =
        defalutOptions.series[2].data =
        defalutOptions.series[4].data =
          [20, 60, 10]
      defalutOptions.series[3].data = defalutOptions.series[5].data = [100, 100, 100]
      defalutOptions.yAxis.data = ["本科及以上", "大专", "大专及一下"]
      setOptions(defalutOptions, [
        "#f7763f", // 颜色值
        "#fa2a31",// 颜色值
        "#ff9d61",// 颜色值
        "#fa2a31",// 颜色值
        "#ff9d61",// 颜色值
        "rgba(247,105,109,0.9)",// 颜色值
        "#fa2a31",// 颜色值
        "#ff9d61",// 颜色值
      ])
    })
    return {
      pipeBarRef,
    }
  },
  components: {
    pipeBar,
  },
}
</script>
<style lang="scss"></style>


 434
434


 被折叠的 条评论
为什么被折叠?
被折叠的 条评论
为什么被折叠?
 到【灌水乐园】发言


