


目录
原文参考:
https://testerhome.com/topics/24873
通过实现Locust的prometheus的exporter,将数据导入到proemtheus,然后由grafana进行数据展示。
什么是proemtheus,请转prometheus
什么是Grafana,请转grafana
Exporter编写
- 需要拓展一个web端接口/export/prometheus ,让prometheus根据配置定时拉取Metric信息,这里需要用到Prometheus 官方提供的 client 库,prometheus_client,来生成符合 Prometheus 规范的 metrics 信息。
pip install prometheus_client - 编写locust版的Exporter,prometheus_exporter.py
# -*- coding: utf-8 -*-# # file: prometheus_exporter # Author: ShunZhe # Date: 2021/7/31 import six from itertools import chain from flask import request, Response from locust import stats as locust_stats, runners as locust_runners from locust import User, task, events from prometheus_client import Metric, REGISTRY, exposition # This locustfile adds an external web endpoint to the locust master, and makes it serve as a prometheus exporter. # Runs it as a normal locustfile, then points prometheus to it. # locust -f prometheus_exporter.py --master # Lots of code taken from [mbolek's locust_exporter](https://github.com/mbolek/locust_exporter), thx mbolek! class LocustCollector(object): registry = REGISTRY def __init__(self, environment, runner): self.environment = environment self.runner = runner def collect(self): # collect metrics only when locust runner is spawning or running. runner = self.runner if runner and runner.state in (locust_runners.STATE_SPAWNING, locust_runners.STATE_RUNNING): stats = [] for s in chain(locust_stats.sort_stats(runner.stats.entries), [runner.stats.total]): stats.append({ "method": s.method, "name": s.name, "num_requests": s.num_requests, "num_failures": s.num_failures, "avg_response_time": s.avg_response_time, "min_response_time": s.min_response_time or 0, "max_response_time": s.max_response_time, "current_rps": s.current_rps, "median_response_time": s.median_response_time, "ninetieth_response_time": s.get_response_time_percentile(0.9), # only total stats can use current_response_time, so sad. # "current_response_time_percentile_95": s.get_current_response_time_percentile(0.95), "avg_content_length": s.avg_content_length, "current_fail_per_sec": s.current_fail_per_sec }) # perhaps StatsError.parse_error in e.to_dict only works in python slave, take notices! errors = [e.to_dict() for e in six.itervalues(runner.stats.errors)] metric = Metric('locust_user_count', 'Swarmed users', 'gauge') metric.add_sample('locust_user_count', value=runner.user_count, labels={}) yield metric metric = Metric('locust_errors', 'Locust requests errors', 'gauge') for err in errors: metric.add_sample('locust_errors', value=err['occurrences'], labels={'path': err['name'], 'method': err['method'], 'error': err['error']}) yield metric is_distributed = isinstance(runner, locust_runners.MasterRunner) if is_distributed: metric = Metric('locust_slave_count', 'Locust number of slaves', 'gauge') metric.add_sample('locust_slave_count', value=len(runner.clients.values()), labels={}) yield metric metric = Metric('locust_fail_ratio', 'Locust failure ratio', 'gauge') metric.add_sample('locust_fail_ratio', value=runner.stats.total.fail_ratio, labels={}) yield metric metric = Metric('locust_state', 'State of the locust swarm', 'gauge') metric.add_sample('locust_state', value=1, labels={'state': runner.state}) yield metric stats_metrics = ['avg_content_length', 'avg_response_time', 'current_rps', 'current_fail_per_sec', 'max_response_time', 'ninetieth_response_time', 'median_response_time', 'min_response_time', 'num_failures', 'num_requests'] for mtr in stats_metrics: mtype = 'gauge' if mtr in ['num_requests', 'num_failures']: mtype = 'counter' metric = Metric('locust_stats_' + mtr, 'Locust stats ' + mtr, mtype) for stat in stats: # Aggregated stat's method label is None, so name it as Aggregated # locust has changed name Total to Aggregated since 0.12.1 if 'Aggregated' != stat['name']: metric.add_sample('locust_stats_' + mtr, value=stat[mtr], labels={'path': stat['name'], 'method': stat['method']}) else: metric.add_sample('locust_stats_' + mtr, value=stat[mtr], labels={'path': stat['name'], 'method': 'Aggregated'}) yield metric @events.init.add_listener def locust_init(environment, runner, **kwargs): print("locust init event received") if environment.web_ui and runner: @environment.web_ui.app.route("/export/prometheus") def prometheus_exporter(): registry = REGISTRY encoder, content_type = exposition.choose_encoder(request.headers.get('Accept')) if 'name[]' in request.args: registry = REGISTRY.restricted_registry(request.args.get('name[]')) body = encoder(registry) return Response(body, content_type=content_type) REGISTRY.register(LocustCollector(environment, runner)) class Dummy(User): @task(20) def hello(self): pass - master启动prometheus_exporter.py文件
# 开始压测并通过浏览器访问,可以看到数据采集的信息如下

http://0.0.0.0:8089/export/prometheus


# HELP python_gc_objects_collected_total Objects collected during gc
# TYPE python_gc_objects_collected_total counter
python_gc_objects_collected_total{generation="0"} 31281.0
python_gc_objects_collected_total{generation="1"} 6190.0
python_gc_objects_collected_total{generation="2"} 351.0
# HELP python_gc_objects_uncollectable_total Uncollectable object found during GC
# TYPE python_gc_objects_uncollectable_total counter
python_gc_objects_uncollectable_total{generation="0"} 0.0
python_gc_objects_uncollectable_total{generation="1"} 0.0
python_gc_objects_uncollectable_total{generation="2"} 0.0
# HELP python_gc_collections_total Number of times this generation was collected
# TYPE python_gc_collections_total counter
python_gc_collections_total{generation="0"} 165.0
python_gc_collections_total{generation="1"} 14.0
python_gc_collections_total{generation="2"} 1.0
# HELP python_info Python platform information
# TYPE python_info gauge
python_info{implementation="CPython",major="3",minor="7",patchlevel="11",version="3.7.11"} 1.0
# HELP process_virtual_memory_bytes Virtual memory size in bytes.
# TYPE process_virtual_memory_bytes gauge
process_virtual_memory_bytes 2.83045888e+08
# HELP process_resident_memory_bytes Resident memory size in bytes.
# TYPE process_resident_memory_bytes gauge
process_resident_memory_bytes 4.9606656e+07
# HELP process_start_time_seconds Start time of the process since unix epoch in seconds.
# TYPE process_start_time_seconds gauge
process_start_time_seconds 1.62781476304e+09
# HELP process_cpu_seconds_total Total user and system CPU time spent in seconds.
# TYPE process_cpu_seconds_total counter
process_cpu_seconds_total 1.3900000000000001
# HELP process_open_fds Number of open file descriptors.
# TYPE process_open_fds gauge
process_open_fds 26.0
# HELP process_max_fds Maximum number of open file descriptors.
# TYPE process_max_fds gauge
process_max_fds 1.048576e+06
# HELP locust_user_count Swarmed users
# TYPE locust_user_count gauge
locust_user_count 30.0
# HELP locust_errors Locust requests errors
# TYPE locust_errors gauge
# HELP locust_slave_count Locust number of slaves
# TYPE locust_slave_count gauge
locust_slave_count 4.0
# HELP locust_fail_ratio Locust failure ratio
# TYPE locust_fail_ratio gauge
locust_fail_ratio 0.0
# HELP locust_state State of the locust swarm
# TYPE locust_state gauge
locust_state{state="spawning"} 1.0
# HELP locust_stats_avg_content_length Locust stats avg_content_length
# TYPE locust_stats_avg_content_length gauge
locust_stats_avg_content_length{method="接收数据",path="0 open"} 114.0
locust_stats_avg_content_length{method="接收数据",path="3 heartbeat"} 1.0
locust_stats_avg_content_length{method="接收数据",path="40 message ok"} 2.0
locust_stats_avg_content_length{method="接收数据",path="42 join_ack"} 8961.85
locust_stats_avg_content_length{method="接收数据",path="42 operation_ack"} 69.0
locust_stats_avg_content_length{method="接收数据",path="42 set_doc_ack"} 28.0
locust_stats_avg_content_length{method="接收数据",path="42 svr_user_status_change"} 154.0
locust_stats_avg_content_length{method="Aggregated",path="Aggregated"} 435.48864105741427
# HELP locust_stats_avg_response_time Locust stats avg_response_time
# TYPE locust_stats_avg_response_time gauge
locust_stats_avg_response_time{method="接收数据",path="0 open"} 0.41
locust_stats_avg_response_time{method="接收数据",path="3 heartbeat"} 38.403225806451616
locust_stats_avg_response_time{method="接收数据",path="40 message ok"} 0.92
locust_stats_avg_response_time{method="接收数据",path="42 join_ack"} 76.88
locust_stats_avg_response_time{method="接收数据",path="42 operation_ack"} 44.30930607853685
locust_stats_avg_response_time{method="接收数据",path="42 set_doc_ack"} 57.24
locust_stats_avg_response_time{method="接收数据",path="42 svr_user_status_change"} 77.93
locust_stats_avg_response_time{method="Aggregated",path="Aggregated"} 43.82073523337464
# HELP locust_stats_current_rps Locust stats current_rps
# TYPE locust_stats_current_rps gauge
locust_stats_current_rps{method="接收数据",path="0 open"} 0.0
locust_stats_current_rps{method="接收数据",path="3 heartbeat"} 0.7
locust_stats_current_rps{method="接收数据",path="40 message ok"} 0.0
locust_stats_current_rps{method="接收数据",path="42 join_ack"} 0.0
locust_stats_current_rps{method="接收数据",path="42 operation_ack"} 11.7
locust_stats_current_rps{method="接收数据",path="42 set_doc_ack"} 0.0
locust_stats_current_rps{method="接收数据",path="42 svr_user_status_change"} 0.0
locust_stats_current_rps{method="Aggregated",path="Aggregated"} 12.4
# HELP locust_stats_current_fail_per_sec Locust stats current_fail_per_sec
# TYPE locust_stats_current_fail_per_sec gauge
locust_stats_current_fail_per_sec{method="接收数据",path="0 open"} 0.0
locust_stats_current_fail_per_sec{method="接收数据",path="3 heartbeat"} 0.0
locust_stats_current_fail_per_sec{method="接收数据",path="40 message ok"} 0.0
locust_stats_current_fail_per_sec{method="接收数据",path="42 join_ack"} 0.0
locust_stats_current_fail_per_sec{method="接收数据",path="42 operation_ack"} 0.0
locust_stats_current_fail_per_sec{method="接收数据",path="42 set_doc_ack"} 0.0
locust_stats_current_fail_per_sec{method="接收数据",path="42 svr_user_status_change"} 0.0
locust_stats_current_fail_per_sec{method="Aggregated",path="Aggregated"} 0.0
# HELP locust_stats_max_response_time Locust stats max_response_time
# TYPE locust_stats_max_response_time gauge
locust_stats_max_response_time{method="接收数据",path="0 open"} 2.0
locust_stats_max_response_time{method="接收数据",path="3 heartbeat"} 159.0
locust_stats_max_response_time{method="接收数据",path="40 message ok"} 5.0
locust_stats_max_response_time{method="接收数据",path="42 join_ack"} 184.0
locust_stats_max_response_time{method="接收数据",path="42 operation_ack"} 317.0
locust_stats_max_response_time{method="接收数据",path="42 set_doc_ack"} 280.0
locust_stats_max_response_time{method="接收数据",path="42 svr_user_status_change"} 185.0
locust_stats_max_response_time{method="Aggregated",path="Aggregated"} 317.0
# HELP locust_stats_ninetieth_response_time Locust stats ninetieth_response_time
# TYPE locust_stats_ninetieth_response_time gauge
locust_stats_ninetieth_response_time{method="接收数据",path="0 open"} 1.0
locust_stats_ninetieth_response_time{method="接收数据",path="3 heartbeat"} 42.0
locust_stats_ninetieth_response_time{method="接收数据",path="40 message ok"} 1.0
locust_stats_ninetieth_response_time{method="接收数据",path="42 join_ack"} 150.0
locust_stats_ninetieth_response_time{method="接收数据",path="42 operation_ack"} 51.0
locust_stats_ninetieth_response_time{method="接收数据",path="42 set_doc_ack"} 67.0
locust_stats_ninetieth_response_time{method="接收数据",path="42 svr_user_status_change"} 150.0
locust_stats_ninetieth_response_time{method="Aggregated",path="Aggregated"} 60.0
# HELP locust_stats_median_response_time Locust stats median_response_time
# TYPE locust_stats_median_response_time gauge
locust_stats_median_response_time{method="接收数据",path="0 open"} 0.0
locust_stats_median_response_time{method="接收数据",path="3 heartbeat"} 34.0
locust_stats_median_response_time{method="接收数据",path="40 message ok"} 1.0
locust_stats_median_response_time{method="接收数据",path="42 join_ack"} 61.0
locust_stats_median_response_time{method="接收数据",path="42 operation_ack"} 40.0
locust_stats_median_response_time{method="接收数据",path="42 set_doc_ack"} 50.0
locust_stats_median_response_time{method="接收数据",path="42 svr_user_status_change"} 62.0
locust_stats_median_response_time{method="Aggregated",path="Aggregated"} 40.0
# HELP locust_stats_min_response_time Locust stats min_response_time
# TYPE locust_stats_min_response_time gauge
locust_stats_min_response_time{method="接收数据",path="0 open"} 0.0
locust_stats_min_response_time{method="接收数据",path="3 heartbeat"} 27.0
locust_stats_min_response_time{method="接收数据",path="40 message ok"} 0.0
locust_stats_min_response_time{method="接收数据",path="42 join_ack"} 50.0
locust_stats_min_response_time{method="接收数据",path="42 operation_ack"} 31.0
locust_stats_min_response_time{method="接收数据",path="42 set_doc_ack"} 42.0
locust_stats_min_response_time{method="接收数据",path="42 svr_user_status_change"} 50.0
locust_stats_min_response_time{method="Aggregated",path="Aggregated"} 0.0
# HELP locust_stats_num_failures_total Locust stats num_failures
# TYPE locust_stats_num_failures_total counter
locust_stats_num_failures{method="接收数据",path="0 open"} 0.0
locust_stats_num_failures{method="接收数据",path="3 heartbeat"} 0.0
locust_stats_num_failures{method="接收数据",path="40 message ok"} 0.0
locust_stats_num_failures{method="接收数据",path="42 join_ack"} 0.0
locust_stats_num_failures{method="接收数据",path="42 operation_ack"} 0.0
locust_stats_num_failures{method="接收数据",path="42 set_doc_ack"} 0.0
locust_stats_num_failures{method="接收数据",path="42 svr_user_status_change"} 0.0
locust_stats_num_failures{method="Aggregated",path="Aggregated"} 0.0
# HELP locust_stats_num_requests_total Locust stats num_requests
# TYPE locust_stats_num_requests_total counter
locust_stats_num_requests{method="接收数据",path="0 open"} 100.0
locust_stats_num_requests{method="接收数据",path="3 heartbeat"} 62.0
locust_stats_num_requests{method="接收数据",path="40 message ok"} 100.0
locust_stats_num_requests{method="接收数据",path="42 join_ack"} 100.0
locust_stats_num_requests{method="接收数据",path="42 operation_ack"} 1859.0
locust_stats_num_requests{method="接收数据",path="42 set_doc_ack"} 100.0
locust_stats_num_requests{method="接收数据",path="42 svr_user_status_change"} 100.0
locust_stats_num_requests{method="Aggregated",path="Aggregated"} 2421.0
Prometheus部署
部署Prometheus,拉取metric数据
docker pull prom/prometheus创建prometheus.yml配置文件(与docker-compose.yml同目录)
global:
  scrape_interval: 15s
  evaluation_interval: 15s

scrape_configs:
  - job_name: prometheus
    static_configs:
      - targets: ['localhost:9090']
        labels:
          instance: prometheus

  - job_name: locust
    metrics_path: '/export/prometheus'
    static_configs:
      - targets: ['192.168.10.206:8089']	# 地址修改为实际地址
        labels:
          instance: locust
启动Prometheus,将9090端口映射出来
# prometheus.yml目录下执行命令
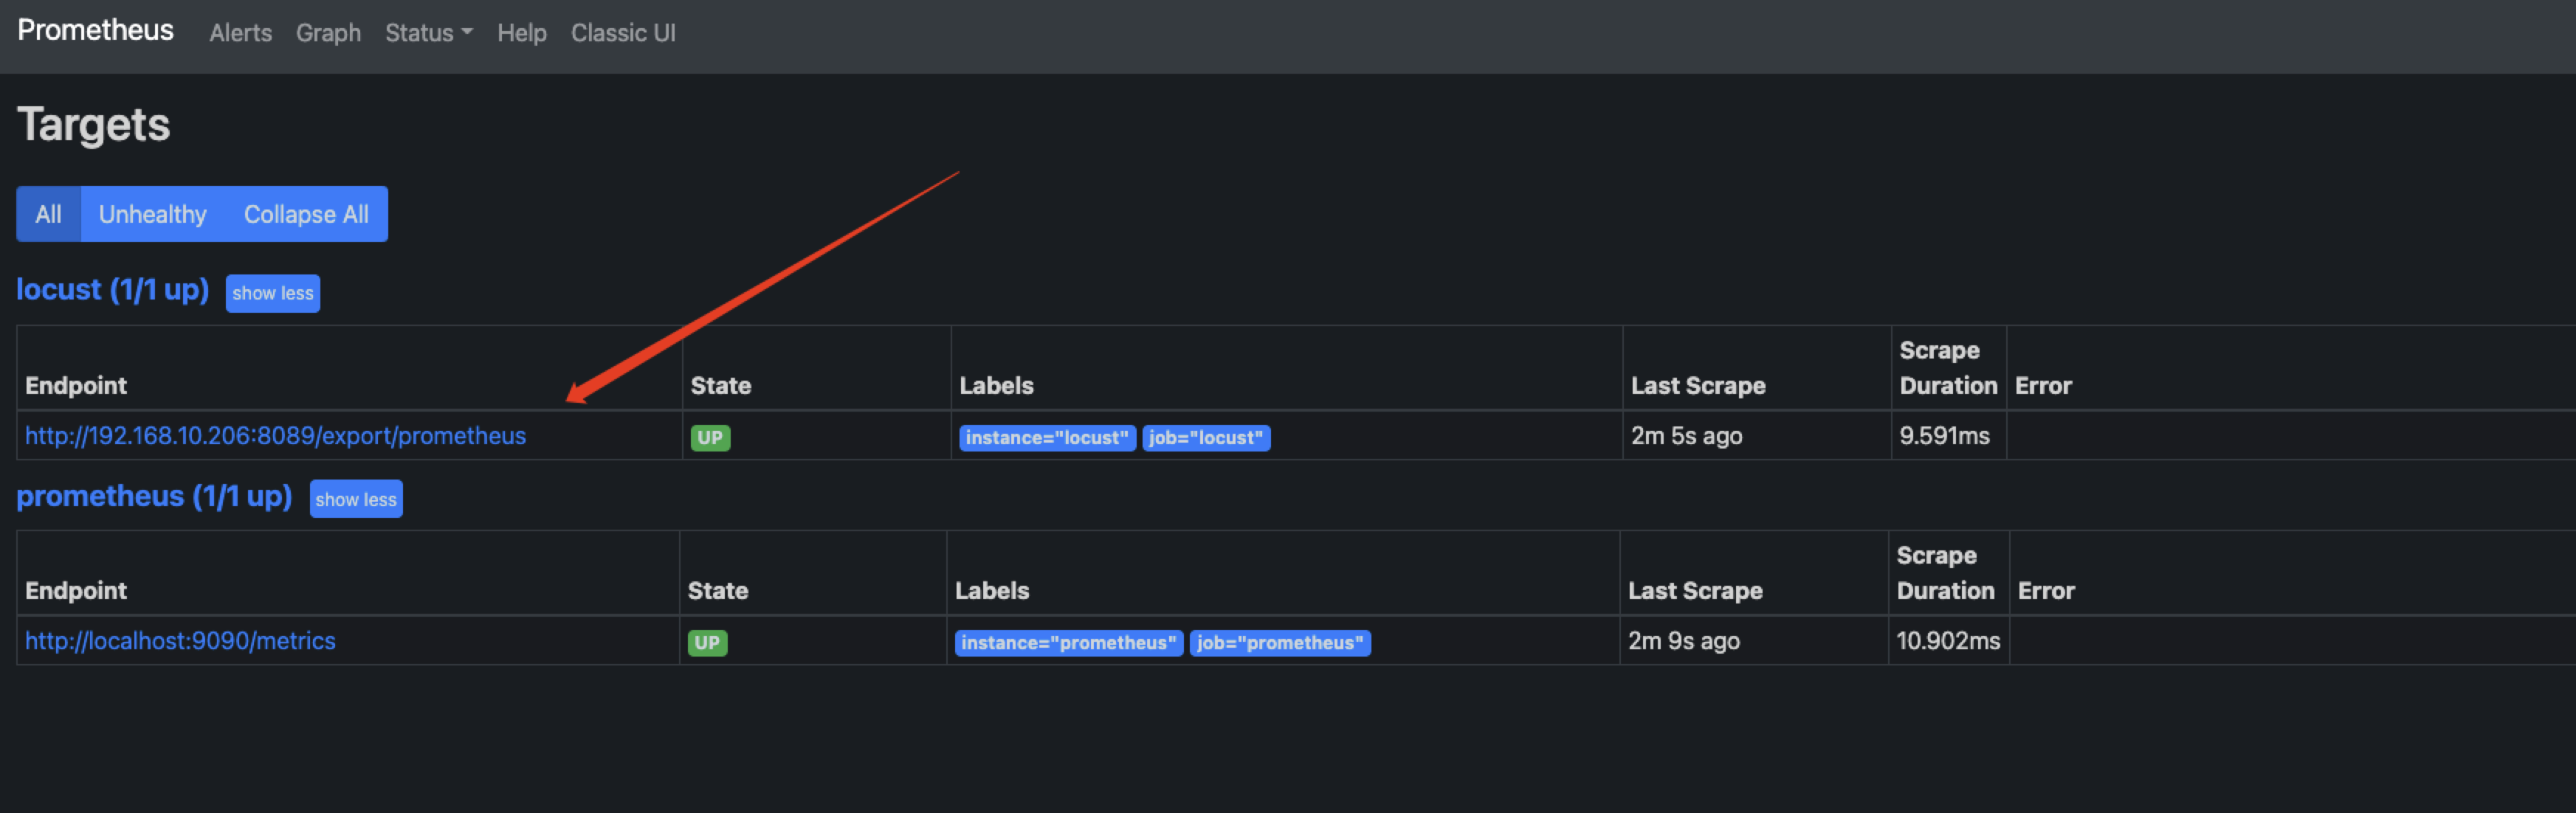
docker run -itd -p 9090:9090 -v $PWD/prometheus/prometheus.yml:/etc/prometheus/prometheus.yml prom/prometheus访问http://<locust_master_ip>:9090/targets查看数据收集是否正常
Grafana部署&配置
拉取grafana镜像
docker pull grafana/grafana启动grafana服务
docker run -d --name grafana -p 3000:3000 grafana/grafana访问http://<ip>:3000/进入grafana,默认账号密码为admin

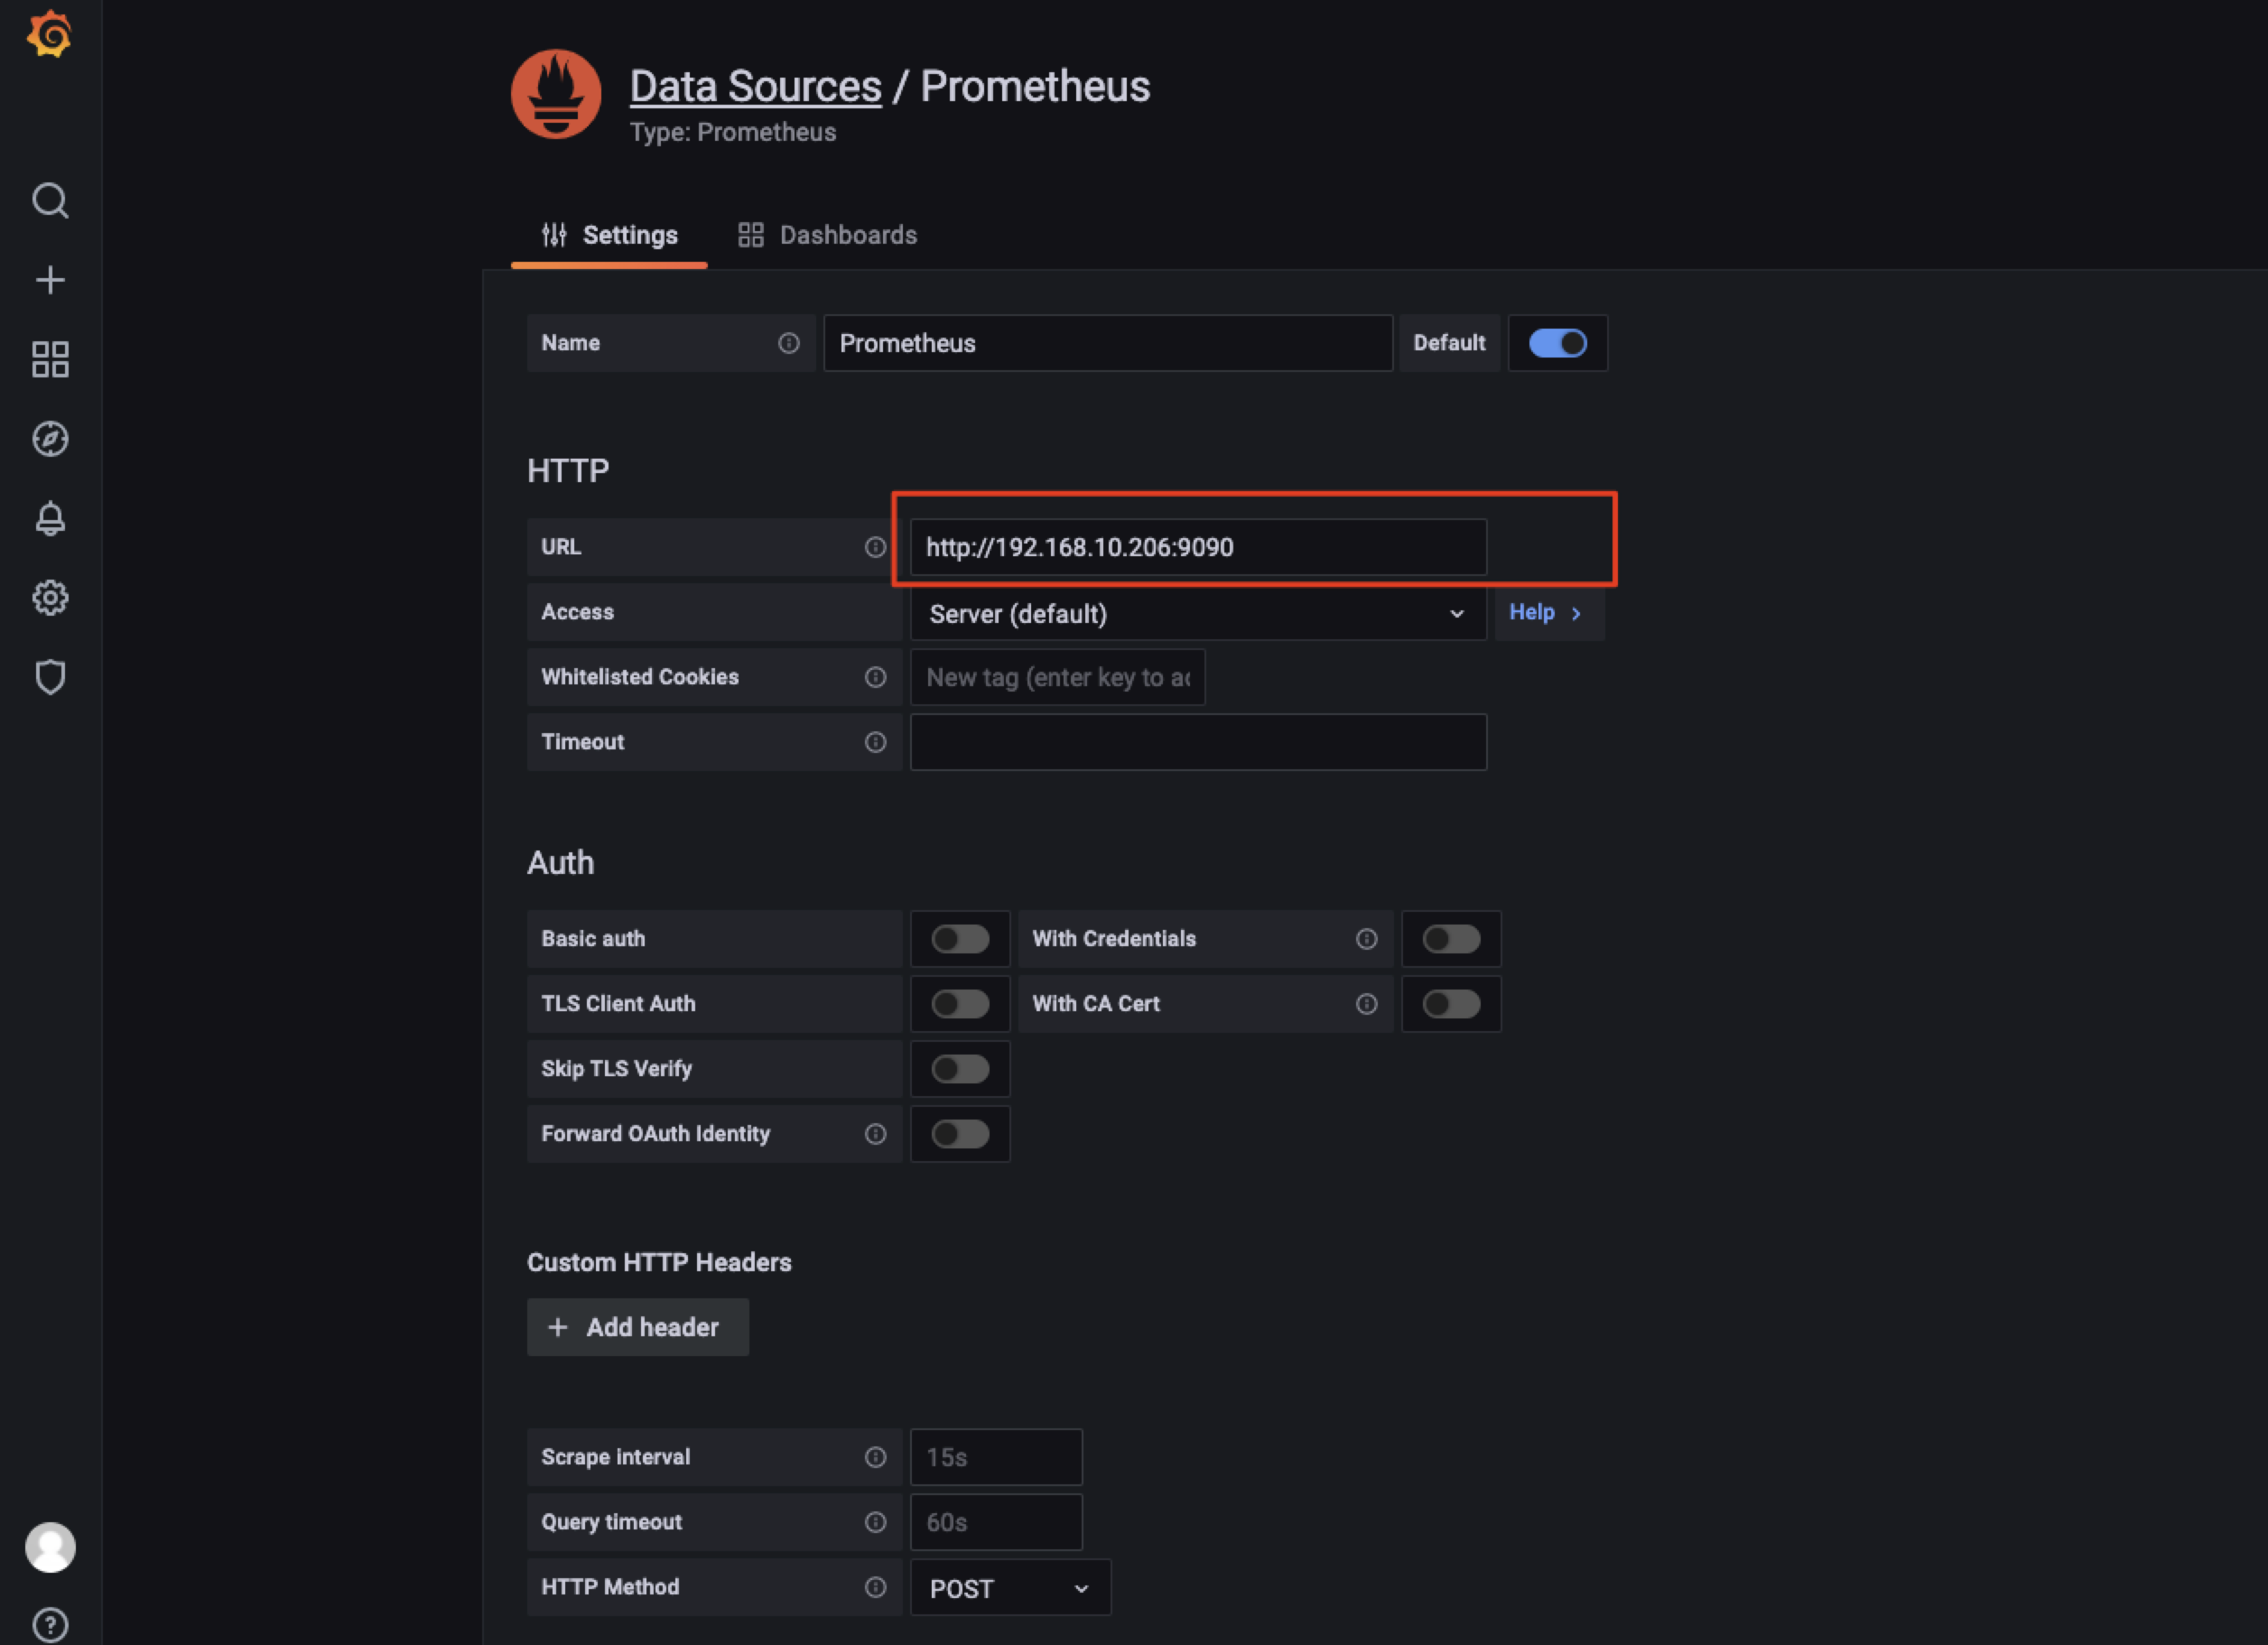
选择添加prometheus数据源
Configuration -- Data sources -- Add data source -- 选择Prometheus
这里的URL 设置为 prometheus的地址:http://<locust_master_ip>:9090
导入DashBoard
通过Dashboard 找到合适的导入
➕ -- import -- load,这里导入的dashboard id是12081
效果展示:


 815
815


 被折叠的 条评论
为什么被折叠?
被折叠的 条评论
为什么被折叠?
 到【灌水乐园】发言


