分布(四)利用python绘制小提琴图

分布(四)利用python绘制小提琴图

小提琴图 (Violin plot)简介

1

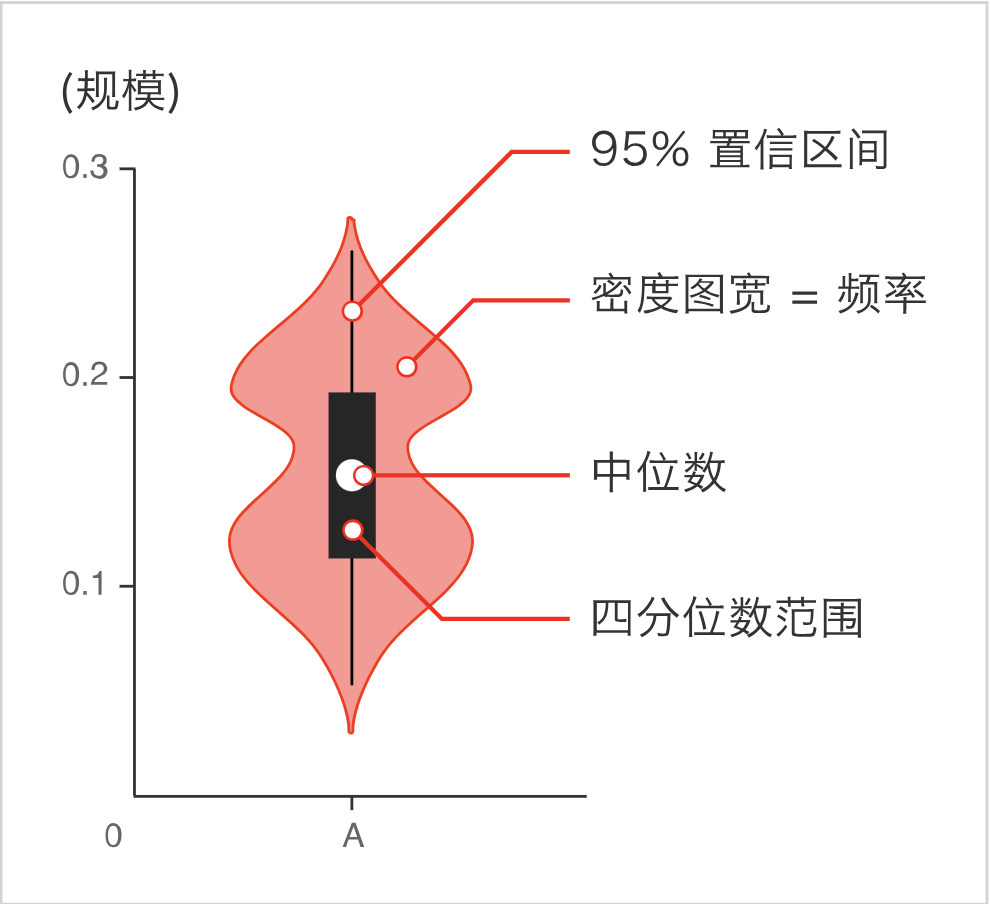
小提琴图主要用于显示数据分布及其概率密度。中间的黑色粗条表示四分位数范围,从其延伸的幼细黑线代表 95% 置信区间(以外则为异常点),而白点则为中位数。小提琴图结合了箱线图和密度图的优点,既可以了解数据统计信息,也可以了解数据分布特点。

快速绘制

  1. 基于seaborn

    import seaborn as sns
    import matplotlib.pyplot as plt
    sns.set(style="darkgrid")
    
    # 导入数据
    df = sns.load_dataset('iris')
    
    # 利用violinplot函数绘制小提琴图
    sns.violinplot(x=df["species"], y=df["sepal_length"])
    
    plt.show()
    

    2

定制多样化的小提琴图

自定义小提琴图一般是结合使用场景对相关参数进行修改,并辅以其他的绘图知识。参数信息可以通过官网进行查看,其他的绘图知识则更多来源于实战经验,大家不妨将接下来的绘图作为一种学习经验,以便于日后总结。

seaborn主要利用violinplot绘制小提琴图,可以通过seaborn.violinplot了解更多用法

  1. 绘制多个小提琴图
import seaborn as sns
import matplotlib.pyplot as plt

sns.set(font='SimHei', font_scale=0.8, style="darkgrid") # 解决Seaborn中文显示问题

# 导入数据
df = sns.load_dataset('iris')
df_tips = sns.load_dataset('tips')

fig, ax = plt.subplots(1,3, figsize=(12,4))

# 多个数值变量的小提琴图
sns.violinplot(data=df.iloc[:,0:2], ax=ax[0])
ax[0].set_title('多个数值变量')

# 一个数值变量多个分组的小提琴图
sns.violinplot( x=df["species"], y=df["sepal_length"], ax=ax[1] )
ax[1].set_title('一个数值变量多个分组')

# 一个数值变量多个分组子分组的小提琴图
sns.violinplot(x="day", y="total_bill", hue="smoker", data=df_tips, palette="Pastel1", ax=ax[2])
ax[2].set_title('一个数值变量多个分组/子分组')

plt.tight_layout()
plt.show()

3

  1. 自定义小提琴图

    • 自定义形状
    import seaborn as sns
    import matplotlib.pyplot as plt
    
    sns.set(font='SimHei', font_scale=0.8, style="darkgrid") # 解决Seaborn中文显示问题
    
    # 导入数据
    df = sns.load_dataset('iris')
    
    # 构造子图
    fig, ax = plt.subplots(1,3,constrained_layout=True, figsize=(12, 4))
    
    # 自定义线宽
    ax_sub = sns.violinplot(x=df["species"], y=df["sepal_length"], linewidth=5, ax=ax[0])
    ax_sub.set_title('自定义线宽')
    
    # 自定义宽度
    ax_sub = sns.violinplot(x=df["species"], y=df["sepal_length"], width=0.3, ax=ax[1])
    ax_sub.set_title('自定义宽度')
    
    # 自定义方向
    ax_sub = sns.violinplot(y=df["species"], x=df["sepal_length"], ax=ax[2])
    ax_sub.set_title('自定义方向')
    
    plt.show()
    

    4

    • 自定义颜色
    import seaborn as sns
    import matplotlib.pyplot as plt
    
    sns.set(font='SimHei', font_scale=0.8, style="darkgrid") # 解决Seaborn中文显示问题
    
    # 导入数据
    df = sns.load_dataset('iris')
    
    # 构造子图
    fig, ax = plt.subplots(1,4,constrained_layout=True, figsize=(12, 4))
    
    # 分配调色板
    ax_sub = sns.violinplot(x=df["species"], y=df["sepal_length"], palette="Blues", ax=ax[0])
    ax_sub.set_title('分配调色板')
    
    # 统一颜色
    ax_sub = sns.violinplot(x=df["species"], y=df["sepal_length"], color='skyblue', ax=ax[1])
    ax_sub.set_title('统一颜色')
    
    # 指定颜色
    my_pal = {"versicolor": "g", "setosa": "b", "virginica":"m"}
    ax_sub = sns.violinplot(x=df["species"], y=df["sepal_length"], palette=my_pal, ax=ax[2])
    ax_sub.set_title('指定颜色')
    
    # 突出颜色:针对指定组
    my_pal = {species: "r" if species == "versicolor" else "b" for species in df.species.unique()}
    ax_sub = sns.violinplot(x=df["species"], y=df["sepal_length"], palette=my_pal, ax=ax[3])
    ax_sub.set_title('突出颜色')
    
    plt.show()
    

    5

    • 自定义顺序
    import seaborn as sns
    import matplotlib.pyplot as plt
    
    sns.set(font='SimHei', font_scale=0.8, style="darkgrid") # 解决Seaborn中文显示问题
    
    # 导入数据
    df = sns.load_dataset('iris')
    
    # 构造子图
    fig, ax = plt.subplots(1,2,constrained_layout=True, figsize=(8, 4))
    
    # 自定义顺序
    ax_sub = sns.violinplot(x='species', y='sepal_length', data=df, order=["versicolor", "virginica", "setosa"], ax=ax[0])
    ax_sub.set_title('指定顺序')
    
    # 按统计量降序:中位数
    my_order = df.groupby(by=["species"])["sepal_length"].median().iloc[::-1].index
    ax_sub = sns.violinplot(x='species', y='sepal_length', data=df, order=my_order, ax=ax[1])
    ax_sub.set_title('中位数降序')
    
    plt.show()
    

    6

  2. 添加额外数据信息

# 添加数据点-蜂窝数据(避免某分组数据过少导致误判)

import pandas as pd
import seaborn as sns
import matplotlib.pyplot as plt

sns.set(font='SimHei', font_scale=0.8, style="darkgrid") # 解决Seaborn中文显示问题

# 导入数据
data = pd.read_csv('https://raw.githubusercontent.com/holtzy/The-Python-Graph-Gallery/master/static/data/sqa_data.csv')

# 自定义颜色
swarmplot_palette = {'Sqa_par':'#8f96bf', 'Sqa_bif':'#ebb0e5', 'Sqa_zz':'#9feed3'}
violin_palette = {'Sqa_par':'#333c70', 'Sqa_bif':'#90367c', 'Sqa_zz':'#34906c'}

# 初始化
sns.set_context('notebook', font_scale=1.2)
fig, ax = plt.subplots(figsize=(9,5))

# 绘制小提琴图
ax = sns.violinplot(y="dist", 
                    x="name", 
                    data=data,
                    palette=violin_palette,
                    scale='count',
                    inner=None
              )

# 绘制蜂窝图
ax = sns.swarmplot(y="dist",
                   x="name",
                   hue="name",
                   data=data, 
                   color="white", 
                   edgecolor="gray",
                   s=5,
                   palette=swarmplot_palette
             )

# 修改标题等信息
ax.set_xticks([0, 1, 2], ['Parallel','Bifurcated','Zig-zag'])
ax.set_xlabel('Squaramide CCSD systems')
ax.set_ylabel(r'$HB distance\ (\AA)$')
plt.ylim(1.5, 3.5)

plt.show()

7

总结

以上通过seaborn的violinplot可以快速绘制小提琴图,并通过修改参数或者辅以其他绘图知识自定义各种各样的小提琴图来适应相关使用场景。

共勉~

  • 18
    点赞
  • 21
    收藏
    觉得还不错? 一键收藏
  • 1
    评论

“相关推荐”对你有帮助么?

  • 非常没帮助
  • 没帮助
  • 一般
  • 有帮助
  • 非常有帮助
提交
评论 1
添加红包

请填写红包祝福语或标题

红包个数最小为10个

红包金额最低5元

当前余额3.43前往充值 >
需支付:10.00
成就一亿技术人!
领取后你会自动成为博主和红包主的粉丝 规则
hope_wisdom
发出的红包
实付
使用余额支付
点击重新获取
扫码支付
钱包余额 0

抵扣说明:

1.余额是钱包充值的虚拟货币,按照1:1的比例进行支付金额的抵扣。
2.余额无法直接购买下载,可以购买VIP、付费专栏及课程。

余额充值