


使用Shape类绘制几何图形,可以控制什么样的形状被绘制,以及它的样式。形状,和文本块、图片一样,是“原子”对象——它们不能包含任何其他对象。因此S类永远不会绘制文本或图像。
Figures
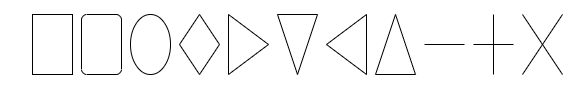
可以将shape.figure属性设置为常用的形状类型。使用GraphObject.make时,可以将图形名作为字符串参数传递。
  mounted () {
    const GO = go.GraphObject.make
    this.diagram = GO(go.Diagram, this.$el)
    this.diagram.add(
      GO(go.Part, 'Horizontal',
        GO(go.Shape, 'Rectangle',        { width: 40, height: 60, margin: 4, fill: null }),
        GO(go.Shape, 'RoundedRectangle', { width: 40, height: 60, margin: 4, fill: null }),
        GO(go.Shape, 'Ellipse',          { width: 40, height: 60, margin: 4, fill: null }),
        GO(go.Shape, 'Diamond',          { width: 40, height: 60, margin: 4, fill: null }),
        GO(go.Shape, 'TriangleRight',    { width: 40, height: 60, margin: 4, fill: null }),
        GO(go.Shape, 'TriangleDown',     { width: 40, height: 60, margin: 4, fill: null }),
        GO(go.Shape, 'TriangleLeft',     { width: 40, height: 60, margin: 4, fill: null }),
        GO(go.Shape, 'TriangleUp',       { width: 40, height: 60, margin: 4, fill: null }),
        GO(go.Shape, 'MinusLine',        { width: 40, height: 60, margin: 4, fill: null }),
        GO(go.Shape, 'PlusLine',         { width: 40, height: 60, margin: 4, fill: null }),
        GO(go.Shape, 'XLine',            { width: 40, height: 60, margin: 4, fill: null })
      ))
  }
创建的图表如下所示:
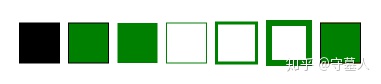
填充和轮廓
Shape.stroke和Shape.fill分别设置轮廓和填充,大多数情况下会提供一个CSS颜色字符串来表示纯色画笔, 默认为实心黑色画笔,但是通常将它们中的一个指定为空或“透明”。空画笔和透明画笔具有相同的外观,但存在明显的区别,具有不同的操作行为。为空时,形成了一个空心的形状,形状中心区域不会触发鼠标点击事件,不会选中该形状所在的节点,但是透明时会形成一个填充的形状,鼠标点击事件在形状内部会被触发。
<template>
  <div class='lean'></div>
</template>
<script>
import go from 'gojs'
export default {
  data () {
    return {
      diagram: ''
    }
  },
  mounted () {
    const GO = go.GraphObject.make
    this.diagram = GO(go.Diagram, this.$el)
    this.diagram.add(
    GO(go.Part, 'Horizontal',
      GO(go.Shape, { figure: 'Rectangle', width: 40, height: 40, margin: 4 }),
      GO(go.Shape, { figure: 'Rectangle', width: 40, height: 40, margin: 4, fill: 'green' }),
      GO(go.Shape, { figure: 'Rectangle', width: 40, height: 40, margin: 4, fill: 'green', stroke: null }),
      GO(go.Shape, { figure: 'Rectangle', width: 40, height: 40, margin: 4, fill: null, stroke: 'green' }),
      GO(go.Shape, { figure: 'Rectangle', width: 40, height: 40, margin: 4, fill: null, stroke: 'green', strokeWidth: 3 }),
      GO(go.Shape, { figure: 'Rectangle', width: 40, height: 40, margin: 4, fill: null, stroke: 'green', strokeWidth: 6 }),
      GO(go.Shape, { figure: 'Rectangle', width: 40, height: 40, margin: 4, fill: 'green', background: 'orange' })
    ))
  }
}
</script>
<style scoped>
.lean {
  height: 100%;
  width: 100%;
}
</style>
创建的图表如下所示:
<template>
  <div class='lean'></div>
</template>
<script>
import go from 'gojs'
export default {
  data () {
    return {
      diagram: ''
    }
  },
  mounted () {
    const GO = go.GraphObject.make
    this.diagram = GO(go.Diagram, this.$el)
    this.diagram.div.style.background = 'lightgray'
    this.diagram.add(
    GO(go.Part, 'Table',
      GO(go.Shape, { row: 0, column: 0, figure: 'TriangleDown', width: 60, height: 60, margin: 4, fill: 'green' }),
      GO(go.TextBlock, 'green', { row: 1, column: 0 }),
      GO(go.Shape, { row: 0, column: 1, figure: 'TriangleDown', width: 60, height: 60, margin: 4, fill: 'white' }),
      GO(go.TextBlock, 'white', { row: 1, column: 1 }),
      GO(go.Shape, { row: 0, column: 2, figure: 'TriangleDown', width: 60, height: 60, margin: 4, fill: 'transparent' }),
      GO(go.TextBlock, 'transparent', { row: 1, column: 2 }),
      GO(go.Shape, { row: 0, column: 3, figure: 'TriangleDown', width: 60, height: 60, margin: 4, fill: null }),
      GO(go.TextBlock, 'null', { row: 1, column: 3 })
    ))
  }
}
</script>
<style scoped>
.lean {
  height: 100%;
  width: 100%;
}
</style>
创建的图表如下所示:
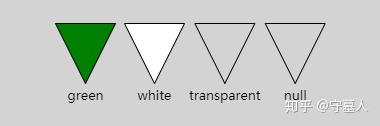
尝试在每个形状内单击以查看哪些形状将响应单击,并使整个面板处于选中状态。请注意,使用“透明”填充可以看到图表背景,但是当您单击它时,您会“点击”该形状。只有最后一个填充为空的,才是真正的“空心”。单击最后一个形状只会导致单击图表背景,除非单击笔划轮廓。(点击倒三角中心,必须是中心,由于图形原因区域比较小)
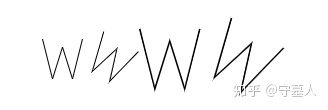
几何图形
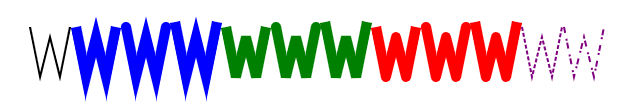
每一个形状都从它使用的几何图形中得到它的“形状”。几何图形只是对给定一组点如何绘制线的保存描述。设置shape.figure使用可参数化的已命名的预定义几何图形。一般来说,给一个几何图形比给它一个图形更有效。
如果您想要一些不同于gojs中所有预定义图形的东西,您可以通过shape.geometry构建自己的几何图形。构建自己几何图形的一种方法是构建由路径段组成的路径图。在构建基于某些数据计算点的几何图形时,这通常是必需的。无需给几何图形设置desiredSize、height和width等属性。
<template>
  <div class='lean'></div>
</template>
<script>
import go from 'gojs'
export default {
  data () {
    return {
      diagram: ''
    }
  },
  mounted () {
    const GO = go.GraphObject.make
    this.diagram = GO(go.Diagram, this.$el)
    let W_geometry = go.Geometry.parse('M 0,0 L 10,50 20,10 30,50 40,0', false)
    this.diagram.add(
    GO(go.Part, 'Horizontal',
      GO(go.Shape, { geometry: W_geometry, strokeWidth: 2 }),
      GO(go.Shape, { geometry: W_geometry, stroke: 'blue', strokeWidth: 10, strokeJoin: 'miter', strokeCap: 'butt' }),
      GO(go.Shape, { geometry: W_geometry, stroke: 'blue', strokeWidth: 10, strokeJoin: 'miter', strokeCap: 'round' }),
      GO(go.Shape, { geometry: W_geometry, stroke: 'blue', strokeWidth: 10, strokeJoin: 'miter', strokeCap: 'square' }),
      GO(go.Shape, { geometry: W_geometry, stroke: 'green', strokeWidth: 10, strokeJoin: 'bevel', strokeCap: 'butt' }),
      GO(go.Shape, { geometry: W_geometry, stroke: 'green', strokeWidth: 10, strokeJoin: 'bevel', strokeCap: 'round' }),
      GO(go.Shape, { geometry: W_geometry, stroke: 'green', strokeWidth: 10, strokeJoin: 'bevel', strokeCap: 'square' }),
      GO(go.Shape, { geometry: W_geometry, stroke: 'red', strokeWidth: 10, strokeJoin: 'round', strokeCap: 'butt' }),
      GO(go.Shape, { geometry: W_geometry, stroke: 'red', strokeWidth: 10, strokeJoin: 'round', strokeCap: 'round' }),
      GO(go.Shape, { geometry: W_geometry, stroke: 'red', strokeWidth: 10, strokeJoin: 'round', strokeCap: 'square' }),
      GO(go.Shape, { geometry: W_geometry, stroke: 'purple', strokeWidth: 2, strokeDashArray: [4, 2] }),
      GO(go.Shape, { geometry: W_geometry, stroke: 'purple', strokeWidth: 2, strokeDashArray: [6, 6, 2, 2] })
    ))
  }
}
</script>
<style scoped>
.lean {
  height: 100%;
  width: 100%;
}
</style>
创建的图表如下所示:
角度和比例
除了设置GraphObject.desiredSize或GraphObject.width和GraphObject.height来声明形状的大小之外,还可以设置其他属性来影响外观。例如,可以设置graphObject.angle和graphObject.scale属性。
<template>
  <div class='lean'></div>
</template>
<script>
import go from 'gojs'
export default {
  data () {
    return {
      diagram: ''
    }
  },
  mounted () {
    const GO = go.GraphObject.make
    this.diagram = GO(go.Diagram, this.$el)
    let W_geometry = go.Geometry.parse('M 0,0 L 10,50 20,10 30,50 40,0', false)
    this.diagram.add(
    GO(go.Part, 'Table',
      GO(go.Shape, { row: 0, column: 1, geometry: W_geometry, width: 40, height: 40 }),
      GO(go.Shape, { row: 0, column: 2, geometry: W_geometry, width: 40, height: 40, angle: 30 }),
      GO(go.Shape, { row: 0, column: 3, geometry: W_geometry, width: 40, height: 40, scale: 1.5 }),
      GO(go.Shape, { row: 0, column: 4, geometry: W_geometry, width: 40, height: 40, angle: 30, scale: 1.5 })
    ))
  }
}
</script>
<style scoped>
.lean {
  height: 100%;
  width: 100%;
}
</style>
创建的图表如下所示:
Shape.fill和GraphObject.background画笔会随形状缩放和旋转。GraphObject.areaBackground是在面板中绘制的,因此它不受对象的比例或角度的影响。
<template>
  <div class='lean'></div>
</template>
<script>
import go from 'gojs'
export default {
  data () {
    return {
      diagram: ''
    }
  },
  mounted () {
    const GO = go.GraphObject.make
    this.diagram = GO(go.Diagram, this.$el)
    let bluered = GO(go.Brush, 'Linear', { 0.0: 'blue', 1.0: 'red' });
    let yellowgreen = GO(go.Brush, 'Linear', { 0.0: 'yellow', 1.0: 'green' });
    let grays = GO(go.Brush, 'Linear', { 0.0: 'black', 1.0: 'lightgray' });
    this.diagram.add(
    GO(go.Part, 'Table',
      GO(go.Shape,
        { row: 0,
          column: 0,
          figure: 'TriangleDown',
          width: 40,
          height: 40,
          angle: 0,
          scale: 1.5,
          fill: bluered,
          background: yellowgreen,
          areaBackground: grays
        }),
      GO(go.Shape, { row: 0, column: 1, width: 10, fill: null, stroke: null }),
      GO(go.Shape,
        { row: 0,
          column: 2,
          figure: 'TriangleDown',
          width: 40,
          height: 40,
          angle: 45,
          scale: 1.5,
          fill: bluered,
          background: yellowgreen,
          areaBackground: grays
        })
    ))
  }
}
</script>
<style scoped>
.lean {
  height: 100%;
  width: 100%;
}
</style>
创建图表如下所示:
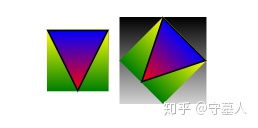
自定义
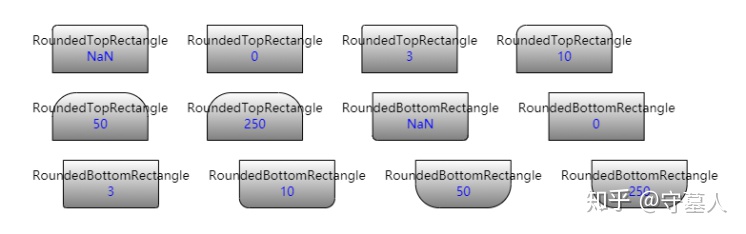
如上图所示,只需设置shape.geometry或shape.geometryString即可轻松创建自定义形状。这在导入SVG时特别方便。但是,也可以定义其他命名图形,当您希望通过设置或数据绑定shape.figure属性轻松指定或更改现有形状的几何图形时,这很方便。
静态函数shape.defineFigureGenerator可用于定义新的图形名称。第二个参数是一个函数,它有形状、宽度和高度三个参数,生成和返回几何图形。这允许基于形状属性和大小参数化几何图形。特别是,在生成几何图形时,除了宽度和高度之外,还可以考虑shape.parameter1和shape.parameter2属性。要有效的生成的几何图形,边界必须等于或小于提供的宽度和高度。
<template>
  <div class='lean'></div>
</template>
<script>
import go from 'gojs'
export default {
  data () {
    return {
      diagram: ''
    }
  },
  mounted () {
    const GO = go.GraphObject.make
    this.diagram = GO(go.Diagram, this.$el)
    this.defineFigureGenerator('RoundedTopRectangle', this.RoundedTopRectangle)
    this.defineFigureGenerator('RoundedBottomRectangle', this.RoundedBottomRectangle)
    this.diagram.nodeTemplate =
      GO(go.Part, 'Spot',
        {
          selectionAdorned: false,
          resizable: true,
          resizeObjectName: 'SHAPE',
          rotatable: true,
          rotateObjectName: 'SHAPE'
        },
        GO(go.Shape,
          {
            name: 'SHAPE',
            fill: GO(go.Brush, 'Linear', { 0.0: 'white', 1.0: 'gray' }),
            desiredSize: new go.Size(100, 50)
          },
          new go.Binding('figure', 'fig'),
          new go.Binding('parameter1', 'p1')),
        GO(go.Panel, 'Vertical',
          GO(go.TextBlock,
            new go.Binding('text', 'fig')),
          GO(go.TextBlock, { stroke: 'blue' },
            new go.Binding('text', 'parameter1', function(p1) { return p1; }).ofObject('SHAPE'))
        )
      )
    this.diagram.model = new go.Model([
      { fig: 'RoundedTopRectangle' },
      { fig: 'RoundedTopRectangle', p1: 0 },
      { fig: 'RoundedTopRectangle', p1: 3 },
      { fig: 'RoundedTopRectangle', p1: 10 },
      { fig: 'RoundedTopRectangle', p1: 50 },
      { fig: 'RoundedTopRectangle', p1: 250 },
      { fig: 'RoundedBottomRectangle' },
      { fig: 'RoundedBottomRectangle', p1: 0 },
      { fig: 'RoundedBottomRectangle', p1: 3 },
      { fig: 'RoundedBottomRectangle', p1: 10 },
      { fig: 'RoundedBottomRectangle', p1: 50 },
      { fig: 'RoundedBottomRectangle', p1: 250 }
    ])
  },
  methods: {
    defineFigureGenerator (name, geo) {
      go.Shape.defineFigureGenerator(name, function(shape, w, h) {
        let p1 = 5
        if (shape !== null) {
          let param1 = shape.parameter1
          if (!isNaN(param1) && param1 >= 0) p1 = param1
        }
        p1 = Math.min(p1, w / 2)
        p1 = Math.min(p1, h / 2)
        return geo(w, h, p1)
      })
    },
    RoundedBottomRectangle (w, h, p1) {
      let geo = new go.Geometry()
      geo.add(new go.PathFigure(0, 0)
        .add(new go.PathSegment(go.PathSegment.Line, w, 0))
        .add(new go.PathSegment(go.PathSegment.Line, w, h - p1))
        .add(new go.PathSegment(go.PathSegment.Arc, 0, 90, w - p1, h - p1, p1, p1))
        .add(new go.PathSegment(go.PathSegment.Line, p1, h))
        .add(new go.PathSegment(go.PathSegment.Arc, 90, 90, p1, h - p1, p1, p1).close()))
      geo.spot1 = new go.Spot(0, 0, 0.3 * p1, 0)
      geo.spot2 = new go.Spot(1, 1, -0.3 * p1, -0.3 * p1)
      return geo
    },
    RoundedTopRectangle (w, h, p1) {
      let geo = new go.Geometry()
      geo.add(new go.PathFigure(0, p1)
        .add(new go.PathSegment(go.PathSegment.Arc, 180, 90, p1, p1, p1, p1))
        .add(new go.PathSegment(go.PathSegment.Line, w - p1, 0))
        .add(new go.PathSegment(go.PathSegment.Arc, 270, 90, w - p1, p1, p1, p1))
        .add(new go.PathSegment(go.PathSegment.Line, w, h))
        .add(new go.PathSegment(go.PathSegment.Line, 0, h).close()))
      geo.spot1 = new go.Spot(0, 0, 0.3 * p1, 0.3 * p1)
      geo.spot2 = new go.Spot(1, 1, -0.3 * p1, 0)
      return geo
    }
  }
}
</script>
<style scoped>
.lean {
  height: 100%;
  width: 100%;
}
</style>
创建图表如下所示:
gojs资料来源官网内容翻译与自己实现绘制,将持续更新,敬请关注


 1063
1063

 被折叠的 条评论
为什么被折叠?
被折叠的 条评论
为什么被折叠?
 到【灌水乐园】发言


