


全文共4659字,预计学习时长12分钟

图源:unsplash
在开始一项数据科学项目时,我们通常需要进行设置或配置,以确保所需的依赖关系,保持输出稳定,准备通用函数。
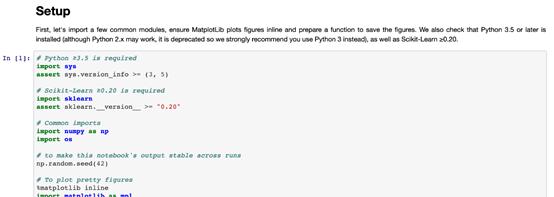
项目设置的一个案例(来自Handson-ML2)
本文将介绍JuypterNotebook中最有帮助的一些项目设置。
1.确保Python版本
检查JupyterNotebook中的Python解释器版本:
import syssys.version'3.7.6 (default, Jan 8 2020, 13:42:34) [Clang 4.0.1 (tags/RELEASE_401/final)]'为确保项目由Python解释器的最低及以上要求版本运行,可在项目设置中添加以下代码:
# Python ≥3.7 is requiredimport sysassert sys.version_info >= (3, 7)Python需要为3.7及以上版本,否则会抛出AssertionError。
2.确保程序包版本
检查安装的程序包版本,如TensorFlow。
import tensorflow as tftf.__version__'2.0.0'确保项目是由TensorFlow2.0及以上版本运行的,否则会抛出AssertionError。
# TensorFlow ≥2.0 is requiredimport tensorflow as tfassert tf.__version__ >= "2.0"3.避免绘制模糊图像
JuypterNotebook中的默认绘图看起来有些模糊。例如,一张查找缺失值的简单热图。(https://towardsdatascience.com/using-pandas-pipe-function-to-improve-code-readability-96d66abfaf8)
import seaborn as snsimport matplotlib.pyplot as plt%matplotlib inline# Default figure format pngsns.heatmap(df.isnull(), yticklabels=False, cbar=False, cmap='viridis')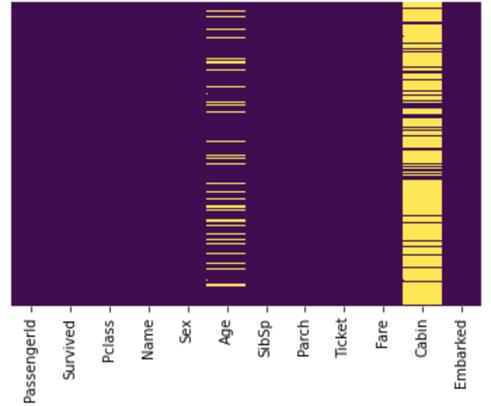
默认图像看起来很模糊
由上图可以看出,文本很模糊,Cabin栏中的缺失值过于拥挤,Embarked栏中的缺失值无法识别。
要解决这个问题,可在%matplotlib inline之后使用%config InlineBackend.figure_format='retina'或 %configInlineBackend.figure_format = 'svg',即:
%matplotlib inline%config InlineBackend.figure_format = 'retina' # or 'svg'sns.heatmap(df.isnull(), yticklabels=False, cbar=False, cmap='viridis')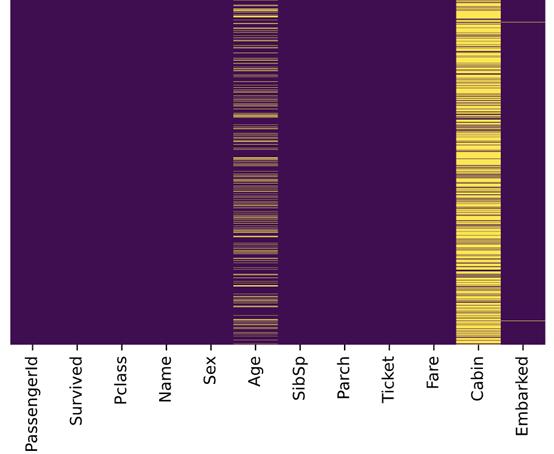
图片格式设置为retina或svg
与先前的图片比较,上图更加清晰,Embarked栏中的缺失值也能成功识别。
4.在不同运行中保持输出稳定
数据科学项目中很多地方都在使用随机数字。例如:
· 来自Scikit-Learn的 train_test_split()
· 用于初始化权重的np.random.rand()
若未重置随机种子,则每次调用都会出现不同的数字:
>>> np.random.rand(4)array([0.83209492, 0.10917076, 0.15798519, 0.99356723])>>> np.random.rand(4)array([0.46183001, 0.7523687 , 0.96599624, 0.32349079])np.random.seed(0)使随机数字可预测:
>>> np.random.seed(0)>>> np.random.rand(4)array([0.5488135 , 0.71518937, 0.60276338, 0.54488318])>>> np.random.seed(0)>>> np.random.rand(4)array([0.5488135 , 0.71518937, 0.60276338, 0.54488318])如果(每次)都重置随机种子,那么每次都会出现相同的数据组。因此,项目能在不同运行中保持输出稳定。
5.多单元输出
默认情况下,JupyterNotebook不能在同一单元中输出多种结果。要输出多种结果,可使用IPython重新配置shell。
from IPython.core.interactiveshell import InteractiveShellInteractiveShell.ast_node_interactivity = "all"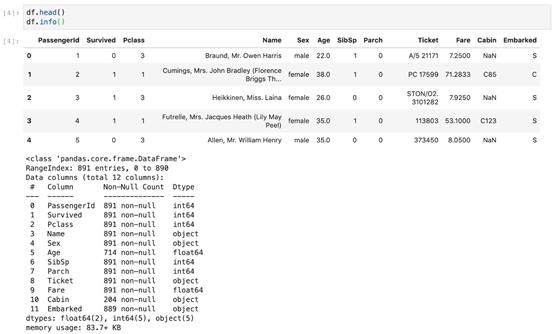
6.将图片保存到文件
Matplotlib能通过savefig()方法保存图片,但如果给定路径不存在则会引发错误。
plt.savefig('./figures/my_plot.png')FileNotFoundError: [Errno 2] Nosuch file or directory: './figures/my_plot.png'最好的做法是将所有图片都放到一个地方,如工作区的figures文件夹。可使用OS GUI(操作系统界面)或是在JupyterNotebook中运行logic指令,来手动创建一个figures文件夹,但是最好创建一个小函数来实现该操作。
当需要一些自定义图形设置或附加子文件夹来分组图形时,这种方法尤其适用。以下是将图片保存到文件的函数:
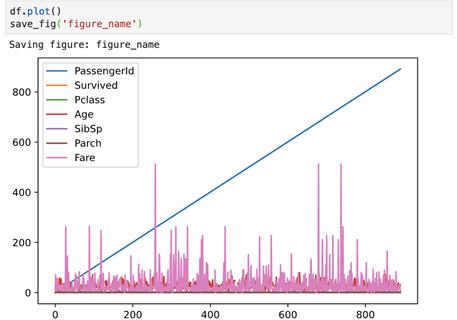
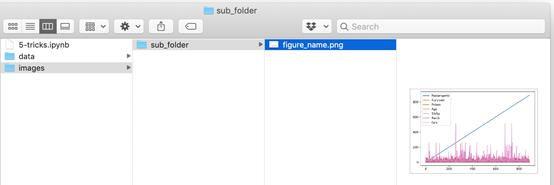
import os%matplotlib inlineimport matplotlib.pyplot as plt# Where to save the figuresPROJECT_ROOT_DIR = "."SUB_FOLDER = "sub_folder" #a sub-folderIMAGES_PATH = os.path.join(PROJECT_ROOT_DIR, "images", SUB_FOLDER)defsave_fig(name, images_path=IMAGES_PATH, tight_layout=True,extension="png", resolution=300): if not os.path.isdir(images_path): os.makedirs(images_path) path = os.path.join(images_path, name+ "." + extension) print("Saving figure:",name) if tight_layout: plt.tight_layout() plt.savefig(path, format=extension,dpi=resolution)现在调用save_fig('figure_name'),会在工作区中创建一个images/sub_folder目录,图片以“figure_name.png”名称被保存到目录中。此外,还提供了三个最常用的设置:
· tight_layout 能自动调整子图填充
· extension 能以多种格式保存图片
· resolution 可设置图片分辨率
7.下载数据(并解压)
处理网络数据对于数据科学工作者是常事。可以使用浏览器下载数据,并运行指令来解压文件,但最好的是创建一个小函数来执行该操作。当数据需要定期更改时,这一点尤其重要。
编写一个小脚本,在获取最新数据时运行(也可以设置一个定期自动执行的计划工作)即可。如果需要在多台机器上安装数据集,自动化抓取数据流程也十分有用。
以下是下载并解压数据的函数:
import osimport tarfileimport zipfileimport urllib # Where to save the dataPROJECT_ROOT_DIR = "."SUB_FOLDER = "group_name"LOCAL_PATH = os.path.join(PROJECT_ROOT_DIR, "datasets", SUB_FOLDER)defdownload(file_url, local_path = LOCAL_PATH): if not os.path.isdir(local_path): os.makedirs(local_path) # Download file print(">>>downloading") filename = os.path.basename(file_url) file_local_path =os.path.join(local_path, filename) urllib.request.urlretrieve(file_url,file_local_path) # untar/unzip file if filename.endswith("tgz")or filename.endswith("tar.gz"): print(">>>unpacking file:", filename) tar =tarfile.open(file_local_path, "r:gz") tar.extractall(path = local_path) tar.close() eliffilename.endswith("tar"): print(">>> unpackingfile:", filename) tar =tarfile.open(file_local_path, "r:") tar.extractall(path = local_path) tar.close() eliffilename.endwith("zip"): print(">>>unpacking file:", filename) zip_file = zipfile.ZipFile(file_local_path) zip_file.extractall(path =local_path) zip_file.close() print("Done")现在调用download("http://a_valid_url/housing.tgz"),会在工作区创建一个datasets/group_name目录,下载housing.tgz,并从该目录中提取出housing.csv ,这个小函数也能用于CSV和文本文件。

图源:unsplash
请查看笔者Github库中的源代码:https://github.com/BindiChen/machine-learning/blob/master/data-analysis/004-7-setups-for-a-data-science-project/7-setups.ipynb

留言点赞关注
我们一起分享AI学习与发展的干货
如转载,请后台留言,遵守转载规范


 被折叠的 条评论
为什么被折叠?
被折叠的 条评论
为什么被折叠?
 到【灌水乐园】发言


