


简介:matplotlib 是Python最著名的绘图库,它提供了一整套和matlab相似的命令API,十分适合交互式地行制图。而且也可以方便地将它作为绘
图控件,嵌入GUI应用程序中。
在Python中使用matplotlib.pyplot快速绘图
下面是matplotlib库所给的介绍
"""
This is an object-oriented plotting library.
这是面向对象的绘图库
A procedural interface is provided by the companion pyplot module,(程序接口直接import matplotlib.pyplot as plt 就可以了,或者使用ipython)
which may be imported directly, e.g.::
import matplotlib.pyplot as plt
or using ipython::
ipython
at your terminal, followed by::
In [1]: %matplotlib
In [2]: import matplotlib.pyplot as plt
at the ipython shell prompt.
For the most part, direct use of the object-oriented library is
encouraged when programming; pyplot is primarily for working
interactively. The
exceptions are the pyplot commands :func:`~matplotlib.pyplot.figure`,
:func:`~matplotlib.pyplot.subplot`,
:func:`~matplotlib.pyplot.subplots`, and
:func:`~pyplot.savefig`, which can greatly simplify scripting.
Modules include: (matplotlib模块里面有axes,figure,artist,lines,........)
:mod:`matplotlib.axes`
defines the :class:`~matplotlib.axes.Axes` class. Most pylab
commands are wrappers for :class:`~matplotlib.axes.Axes`
methods. The axes module is the highest level of OO access to
the library.
:mod:`matplotlib.figure`
defines the :class:`~matplotlib.figure.Figure` class.
:mod:`matplotlib.artist`
defines the :class:`~matplotlib.artist.Artist` base class for
all classes that draw things.
:mod:`matplotlib.lines`
defines the :class:`~matplotlib.lines.Line2D` class for
drawing lines and markers
:mod:`matplotlib.patches`
defines classes for drawing polygons
:mod:`matplotlib.text`
defines the :class:`~matplotlib.text.Text`,
:class:`~matplotlib.text.TextWithDash`, and
:class:`~matplotlib.text.Annotate` classes
:mod:`matplotlib.image`
defines the :class:`~matplotlib.image.AxesImage` and
:class:`~matplotlib.image.FigureImage` classes
:mod:`matplotlib.collections`
classes for efficient drawing of groups of lines or polygons
:mod:`matplotlib.colors`
classes for interpreting color specifications and for making
colormaps
:mod:`matplotlib.cm`
colormaps and the :class:`~matplotlib.image.ScalarMappable`
mixin class for providing color mapping functionality to other
classes
:mod:`matplotlib.ticker`
classes for calculating tick mark locations and for formatting
tick labels
:mod:`matplotlib.backends`
a subpackage with modules for various gui libraries and output
formats
The base matplotlib namespace includes:
:data:`~matplotlib.rcParams`
a global dictionary of default configuration settings. It is
initialized by code which may be overridded by a matplotlibrc
file.
:func:`~matplotlib.rc`
a function for setting groups of rcParams values
:func:`~matplotlib.use`
a function for setting the matplotlib backend. If used, this
function must be called immediately after importing matplotlib
for the first time. In particular, it must be called
**before** importing pylab (if pylab is imported).
matplotlib was initially written by John D. Hunter (1968-2012) and is now
developed and maintained by a host of others.
Occasionally the internal documentation (python docstrings) will refer
to MATLAB®, a registered trademark of The MathWorks, Inc.
"""阅读后,我们明白matplotlib实际上是一套面向对象的绘图库,它所绘制的图表中的每个绘图元素,例如线条Line2D、文字Text、刻度等在内存中都有一个对象与之对应。
我们只需要调用pyplot模块所提供的函数就可以实现快速绘图以及设置图表的各种细节。
def sca(ax):
"""
Set the current Axes instance to *ax*.
The current Figure is updated to the parent of *ax*.
"""
managers = _pylab_helpers.Gcf.get_all_fig_managers()
for m in managers:
if ax in m.canvas.figure.axes:
_pylab_helpers.Gcf.set_active(m)
m.canvas.figure.sca(ax)
return
raise ValueError("Axes instance argument was not found in a figure.")
def gcf():
"Get a reference to the current figure."
figManager = _pylab_helpers.Gcf.get_active()
if figManager is not None:
return figManager.canvas.figure
else:
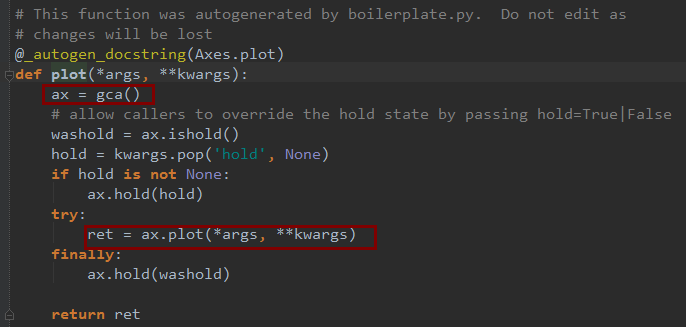
return figure()为了将面向对象的绘图库包装成只使用函数的调用接口,pyplot模块的内部保存了当前图表以及当前子图等信息。当前的图表和子图可以使用plt.gcf()和plt.gca()获得,分别表示"Get Current Figure"和"Get Current Axes"。在pyplot模块中,许多函数都是对当前的Figure或Axes对象进行处理,比如说:
plt.plot()实际上会通过plt.gca()获得当前的Axes对象ax,然后再调用ax.plot()方法实现真正的绘图。
绘制多子图(快速绘图)
Matplotlib 里的常用类的包含关系为 Figure -> Axes -> (Line2D, Text, etc.)一个Figure对象可以包含多个子图(Axes),在matplotlib中用Axes对象表示一个绘图区域,可以理解为子图。
可以使用subplot()快速绘制包含多个子图的图表,它的调用形式如下:
subplot(numRows, numCols, plotNum)
subplot将整个绘图区域等分为numRows行* numCols列个子区域,然后plotNum(1<=plotNum<=4且plotNum必须为正整数)按照从左到右,从上到下的顺序对每个子区域进行编号,左上的子区域的编号为1。如果numRows,numCols和plotNum这三个数都小于10的话,可以把它们缩写为一个整数,例如subplot(323)和subplot(3,2,3)是相同的,其中最后一位的3表示在第三象限画图的。subplot在plotNum指定的区域中创建一个轴对象。如果新创建的轴和之前创建的轴重叠的话,之前的轴将被删除。
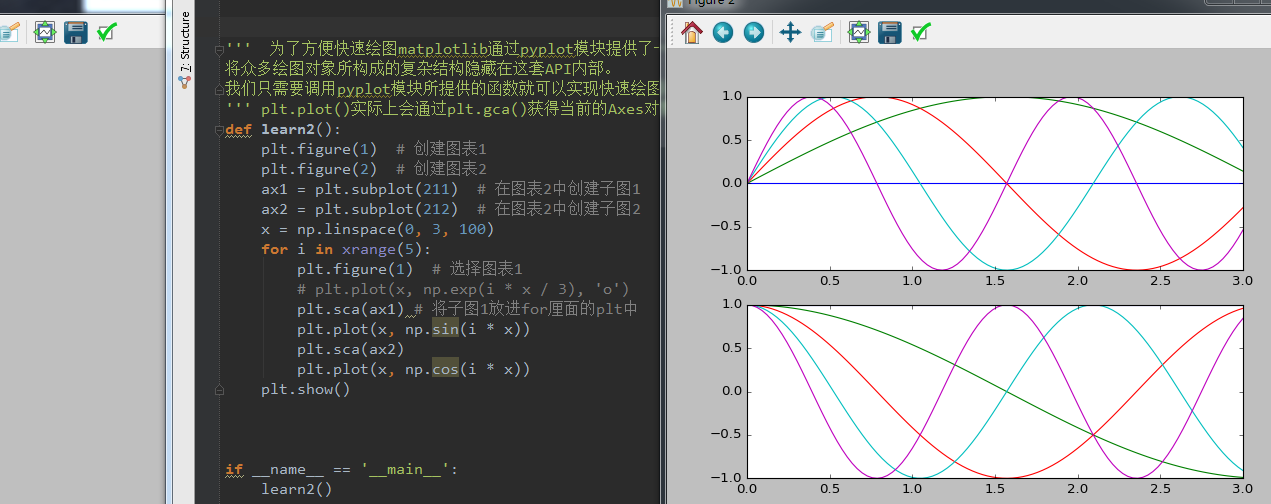
''' 为了方便快速绘图matplotlib通过pyplot模块提供了一套和MATLAB类似的绘图API,
将众多绘图对象所构成的复杂结构隐藏在这套API内部。
我们只需要调用pyplot模块所提供的函数就可以实现快速绘图以及设置图表的各种细节 '''
''' plt.plot()实际上会通过plt.gca()获得当前的Axes对象ax,然后再调用ax.plot()方法实现真正的绘图。 '''
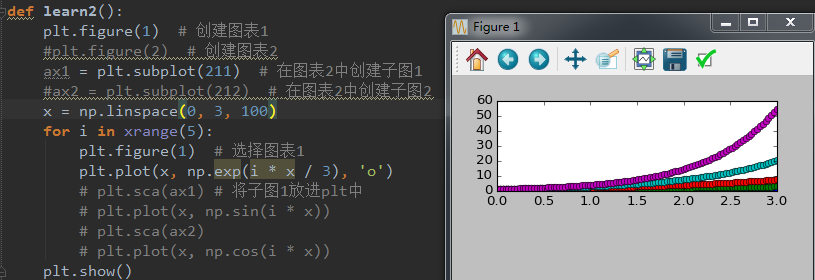
def learn2():
plt.figure(1) # 创建图表1
plt.figure(2) # 创建图表2
ax1 = plt.subplot(211) # 在图表2中创建子图1
ax2 = plt.subplot(212) # 在图表2中创建子图2
x = np.linspace(0, 3, 100)
for i in xrange(5):
plt.figure(1) # 选择图表1
# plt.plot(x, np.exp(i * x / 3), 'o')
plt.sca(ax1) # 将子图1放进for厘面的plt中
plt.plot(x, np.sin(i * x))
plt.sca(ax2)
plt.plot(x, np.cos(i * x))
plt.show()参考来自:
http://www.voidcn.com/article/p-kdngefxg-bp.html


 137
137

 被折叠的 条评论
为什么被折叠?
被折叠的 条评论
为什么被折叠?
 到【灌水乐园】发言


